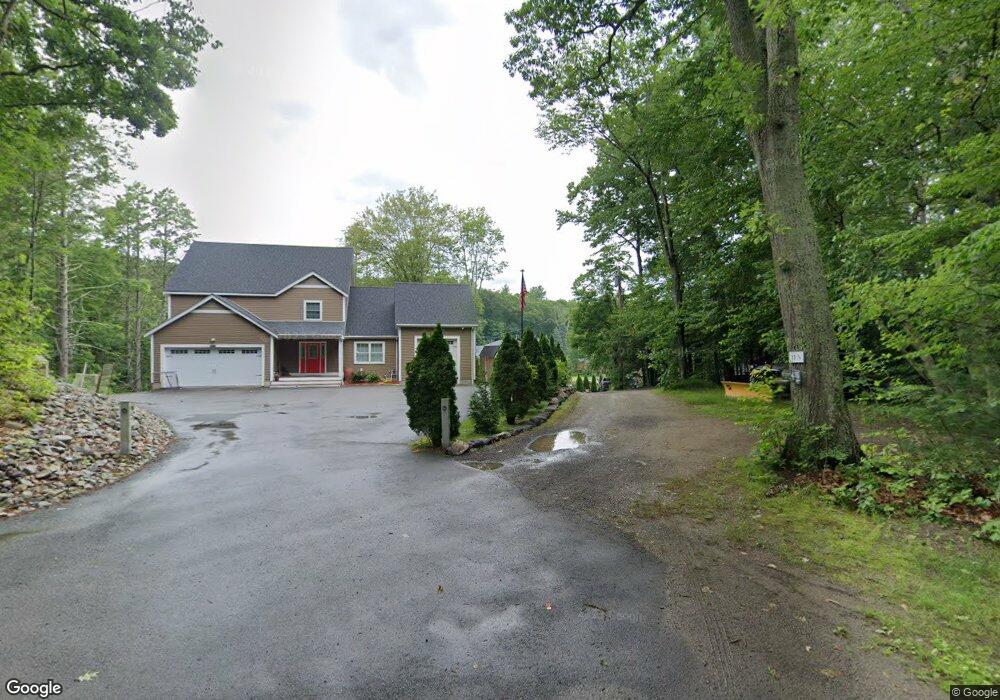
11 1/2 Marsh Rd Sutton, MA 01590
Estimated Value: $684,000 - $752,366
3
Beds
1
Bath
782
Sq Ft
$919/Sq Ft
Est. Value
About This Home
This home is located at 11 1/2 Marsh Rd, Sutton, MA 01590 and is currently estimated at $718,342, approximately $918 per square foot. 11 1/2 Marsh Rd is a home located in Worcester County with nearby schools including Sutton Elementary School, Sutton Middle School, and Sutton High School.
Ownership History
Date
Name
Owned For
Owner Type
Purchase Details
Closed on
Jun 26, 2023
Sold by
Rapp Jonathan and Rapp Elizabeth S
Bought by
Nash Timothy and Nash Kindsey T
Current Estimated Value
Purchase Details
Closed on
Jun 19, 2015
Sold by
Cardin Joyce
Bought by
Nash James and Nash Barbara A
Home Financials for this Owner
Home Financials are based on the most recent Mortgage that was taken out on this home.
Original Mortgage
$186,750
Interest Rate
3%
Mortgage Type
New Conventional
Purchase Details
Closed on
Aug 16, 2006
Sold by
Cardin Joyce and Cardin Norman F
Bought by
Cardin Joyce
Create a Home Valuation Report for This Property
The Home Valuation Report is an in-depth analysis detailing your home's value as well as a comparison with similar homes in the area
Home Values in the Area
Average Home Value in this Area
Purchase History
We collect this data history from publicly available records. To have your information removed, we recommend requesting removal directly through your county’s website.
| Date | Buyer | Sale Price | Title Company |
|---|---|---|---|
| Nash Timothy | -- | None Available | |
| Nash Timothy J | -- | None Available | |
| Nash James | $249,000 | -- | |
| Nash James J | $249,000 | -- | |
| Cardin Joyce | -- | -- | |
| Cardin Joyce V | -- | -- | |
| Cardin Joyce | -- | -- |
Source: Public Records
Mortgage History
We collect this data history from publicly available records. To have your information removed, we recommend requesting removal directly through your county’s website.
| Date | Status | Borrower | Loan Amount |
|---|---|---|---|
| Previous Owner | Nash James J | $186,750 |
Source: Public Records
Tax History
| Year | Tax Paid | Tax Assessment Tax Assessment Total Assessment is a certain percentage of the fair market value that is determined by local assessors to be the total taxable value of land and additions on the property. | Land | Improvement |
|---|---|---|---|---|
| 2025 | $8,390 | $698,000 | $457,400 | $240,600 |
| 2024 | $7,091 | $559,222 | $368,222 | $191,000 |
| 2023 | $6,624 | $478,300 | $333,000 | $145,300 |
| 2022 | $5,873 | $386,876 | $266,176 | $120,700 |
| 2021 | $6,091 | $380,700 | $266,200 | $114,500 |
| 2020 | $5,960 | $375,800 | $266,200 | $109,600 |
| 2019 | $5,647 | $341,800 | $255,000 | $86,800 |
| 2018 | $5,566 | $336,300 | $255,000 | $81,300 |
| 2017 | $4,980 | $301,800 | $218,300 | $83,500 |
| 2016 | $4,979 | $298,500 | $218,300 | $80,200 |
| 2015 | $4,906 | $294,100 | $218,300 | $75,800 |
| 2014 | $4,936 | $292,400 | $221,600 | $70,800 |
Source: Public Records
Map
Nearby Homes
- 5 1/2 W Sutton Rd
- 66 Hutchinson Rd
- 47 Singletary Ave
- 37 W Millbury Rd
- 5 Putnam Hill Rd
- 0 W Main St
- 416 Boston Rd
- 6 Ashton Ln Unit 6
- 37 Putnam Hill Rd
- 1 Burbank Rd
- 63 Uxbridge Rd
- 128 Worcester Providence Turnpike
- 124 Worcester Providence Turnpike
- 11 Elmwood Terrace Unit A
- 32 Sibley Rd
- 108 Worcester Providence Turnpike
- 9 Cyndy Ln
- 186 8 Lots Rd
- 3 Moore Dr
- 399 Central Turnpike
Your Personal Tour Guide
Ask me questions while you tour the home.