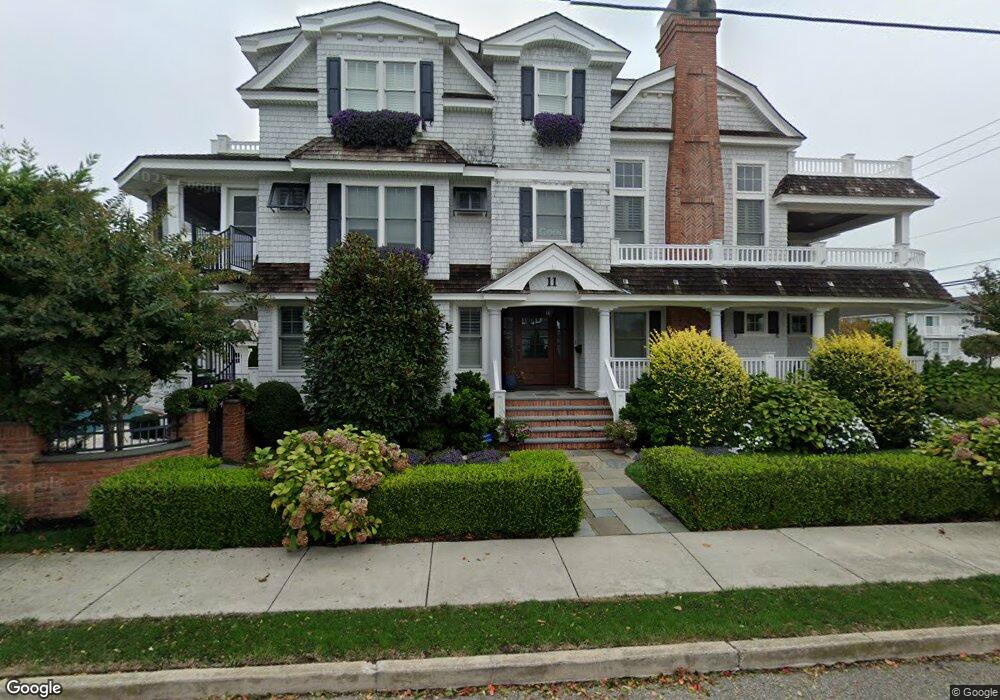
11 16th St W Unit C11 Avalon, NJ 08202
Estimated Value: $3,452,000 - $5,210,000
--
Bed
--
Bath
4,574
Sq Ft
$1,013/Sq Ft
Est. Value
About This Home
This home is located at 11 16th St W Unit C11, Avalon, NJ 08202 and is currently estimated at $4,631,711, approximately $1,012 per square foot. 11 16th St W Unit C11 is a home located in Cape May County with nearby schools including Avalon Elementary School.
Ownership History
Date
Name
Owned For
Owner Type
Purchase Details
Closed on
Jun 8, 2012
Sold by
Morris Edward A and Morris Cheryl A
Bought by
Doane Richard and Doane Diane
Current Estimated Value
Home Financials for this Owner
Home Financials are based on the most recent Mortgage that was taken out on this home.
Original Mortgage
$836,500
Outstanding Balance
$563,709
Interest Rate
3.25%
Mortgage Type
New Conventional
Estimated Equity
$4,068,002
Purchase Details
Closed on
Nov 19, 2004
Sold by
Legar Arthur L and Legar Joanne W
Bought by
Morris Edward A and Morris Cheryl A
Home Financials for this Owner
Home Financials are based on the most recent Mortgage that was taken out on this home.
Original Mortgage
$360,000
Interest Rate
4.49%
Mortgage Type
Purchase Money Mortgage
Create a Home Valuation Report for This Property
The Home Valuation Report is an in-depth analysis detailing your home's value as well as a comparison with similar homes in the area
Home Values in the Area
Average Home Value in this Area
Purchase History
| Date | Buyer | Sale Price | Title Company |
|---|---|---|---|
| Doane Richard | $1,195,000 | Multiple | |
| Morris Edward A | $450,000 | Title Alliance Of Cape May C |
Source: Public Records
Mortgage History
| Date | Status | Borrower | Loan Amount |
|---|---|---|---|
| Open | Doane Richard | $836,500 | |
| Previous Owner | Morris Edward A | $360,000 |
Source: Public Records
Tax History Compared to Growth
Tax History
| Year | Tax Paid | Tax Assessment Tax Assessment Total Assessment is a certain percentage of the fair market value that is determined by local assessors to be the total taxable value of land and additions on the property. | Land | Improvement |
|---|---|---|---|---|
| 2025 | $15,692 | $2,555,700 | $1,250,000 | $1,305,700 |
| 2024 | $15,692 | $2,555,700 | $1,250,000 | $1,305,700 |
| 2023 | $15,564 | $2,555,700 | $1,250,000 | $1,305,700 |
| 2022 | $14,516 | $2,555,700 | $1,250,000 | $1,305,700 |
| 2021 | $13,980 | $2,555,700 | $1,250,000 | $1,305,700 |
| 2020 | $13,443 | $2,555,700 | $1,250,000 | $1,305,700 |
| 2019 | $13,034 | $2,555,700 | $1,250,000 | $1,305,700 |
| 2018 | $12,472 | $2,555,700 | $1,250,000 | $1,305,700 |
| 2017 | $11,558 | $2,078,700 | $945,000 | $1,133,700 |
| 2016 | $11,433 | $2,078,700 | $945,000 | $1,133,700 |
| 2015 | $11,246 | $2,078,700 | $945,000 | $1,133,700 |
| 2014 | $11,121 | $1,079,800 | $945,000 | $134,800 |
Source: Public Records
Map
Nearby Homes