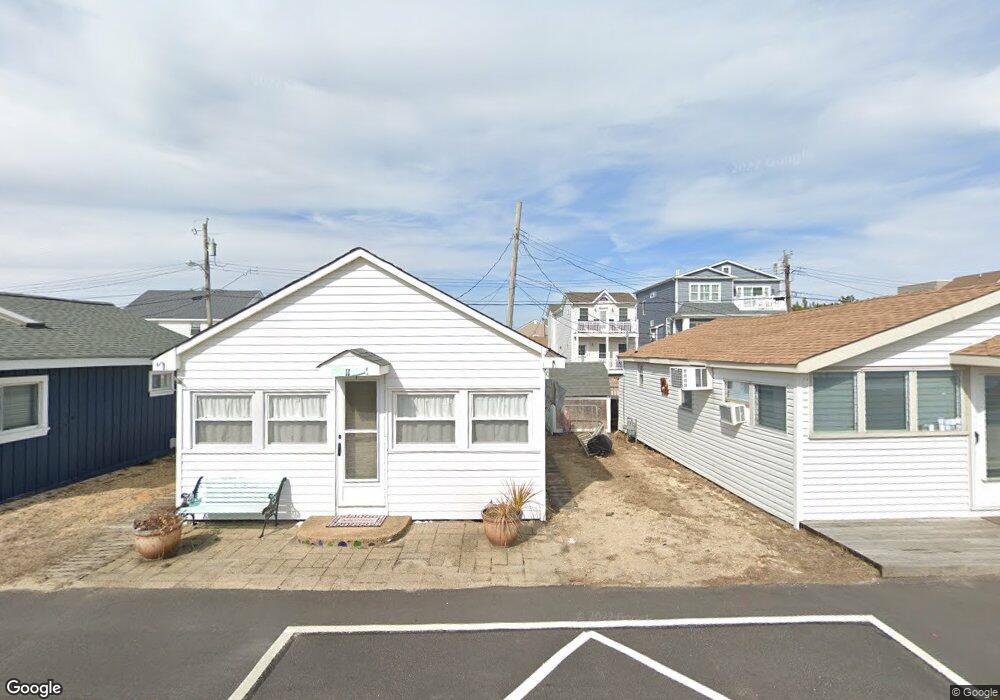
11 1st Ln Unit 11C11 Seaside Park, NJ 08752
Estimated Value: $533,576 - $742,000
3
Beds
1
Bath
387
Sq Ft
$1,590/Sq Ft
Est. Value
About This Home
This home is located at 11 1st Ln Unit 11C11, Seaside Park, NJ 08752 and is currently estimated at $615,394, approximately $1,590 per square foot. 11 1st Ln Unit 11C11 is a home located in Ocean County with nearby schools including Central Regional Middle School and Central Regional High School.
Ownership History
Date
Name
Owned For
Owner Type
Purchase Details
Closed on
Jul 2, 2010
Sold by
Corrigan Frank and Corrigan Helen
Bought by
Pepe Susan
Current Estimated Value
Home Financials for this Owner
Home Financials are based on the most recent Mortgage that was taken out on this home.
Original Mortgage
$318,250
Outstanding Balance
$211,904
Interest Rate
4.76%
Mortgage Type
New Conventional
Estimated Equity
$403,490
Create a Home Valuation Report for This Property
The Home Valuation Report is an in-depth analysis detailing your home's value as well as a comparison with similar homes in the area
Home Values in the Area
Average Home Value in this Area
Purchase History
| Date | Buyer | Sale Price | Title Company |
|---|---|---|---|
| Pepe Susan | $335,000 | None Available |
Source: Public Records
Mortgage History
| Date | Status | Borrower | Loan Amount |
|---|---|---|---|
| Open | Pepe Susan | $318,250 |
Source: Public Records
Tax History Compared to Growth
Tax History
| Year | Tax Paid | Tax Assessment Tax Assessment Total Assessment is a certain percentage of the fair market value that is determined by local assessors to be the total taxable value of land and additions on the property. | Land | Improvement |
|---|---|---|---|---|
| 2025 | $7,831 | $324,800 | $282,000 | $42,800 |
| 2024 | $7,535 | $324,800 | $282,000 | $42,800 |
| 2023 | $7,396 | $324,800 | $282,000 | $42,800 |
| 2022 | $7,396 | $324,800 | $282,000 | $42,800 |
| 2021 | $7,240 | $324,800 | $282,000 | $42,800 |
| 2020 | $7,240 | $324,800 | $282,000 | $42,800 |
| 2019 | $7,038 | $324,800 | $282,000 | $42,800 |
| 2018 | $7,016 | $324,800 | $282,000 | $42,800 |
| 2017 | $6,756 | $324,800 | $282,000 | $42,800 |
| 2016 | $6,720 | $324,800 | $282,000 | $42,800 |
| 2015 | $6,535 | $324,800 | $282,000 | $42,800 |
| 2014 | $6,350 | $324,800 | $282,000 | $42,800 |
Source: Public Records
Map
Nearby Homes