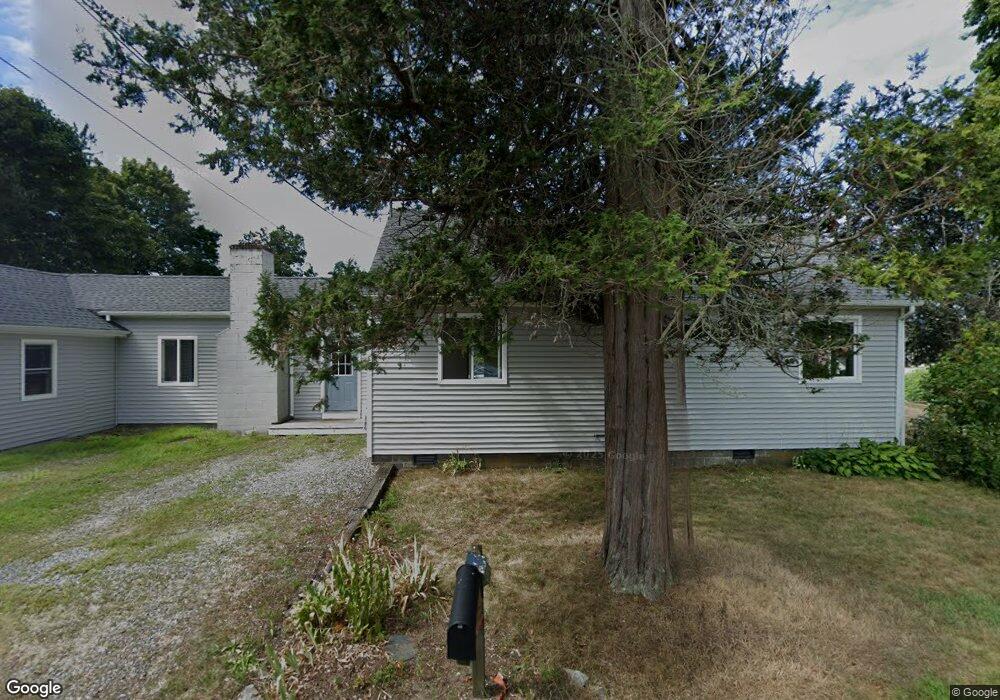
11 2nd St North Kingstown, RI 02852
Wickford NeighborhoodEstimated Value: $898,000 - $1,199,000
3
Beds
2
Baths
1,749
Sq Ft
$612/Sq Ft
Est. Value
About This Home
This home is located at 11 2nd St, North Kingstown, RI 02852 and is currently estimated at $1,070,980, approximately $612 per square foot. 11 2nd St is a home located in Washington County with nearby schools including Fishing Cove Elementary School, Davisville Middle School, and North Kingstown Sr. High School.
Ownership History
Date
Name
Owned For
Owner Type
Purchase Details
Closed on
May 8, 2001
Sold by
Panciera Yolanda
Bought by
Caito Robert P and Caito Ann M
Current Estimated Value
Home Financials for this Owner
Home Financials are based on the most recent Mortgage that was taken out on this home.
Original Mortgage
$110,000
Interest Rate
6.85%
Create a Home Valuation Report for This Property
The Home Valuation Report is an in-depth analysis detailing your home's value as well as a comparison with similar homes in the area
Home Values in the Area
Average Home Value in this Area
Purchase History
| Date | Buyer | Sale Price | Title Company |
|---|---|---|---|
| Caito Robert P | $275,000 | -- |
Source: Public Records
Mortgage History
| Date | Status | Borrower | Loan Amount |
|---|---|---|---|
| Open | Caito Robert P | $450,000 | |
| Closed | Caito Robert P | $200,000 | |
| Closed | Caito Robert P | $110,700 | |
| Closed | Caito Robert P | $110,000 |
Source: Public Records
Tax History Compared to Growth
Tax History
| Year | Tax Paid | Tax Assessment Tax Assessment Total Assessment is a certain percentage of the fair market value that is determined by local assessors to be the total taxable value of land and additions on the property. | Land | Improvement |
|---|---|---|---|---|
| 2025 | $13,825 | $1,252,300 | $880,500 | $371,800 |
| 2024 | $12,299 | $857,700 | $570,100 | $287,600 |
| 2023 | $12,299 | $857,700 | $570,100 | $287,600 |
| 2022 | $12,059 | $857,700 | $570,100 | $287,600 |
| 2021 | $9,685 | $553,400 | $322,000 | $231,400 |
| 2020 | $9,458 | $553,400 | $322,000 | $231,400 |
| 2019 | $9,458 | $553,400 | $322,000 | $231,400 |
| 2018 | $9,212 | $485,600 | $322,000 | $163,600 |
| 2017 | $9,027 | $485,600 | $322,000 | $163,600 |
| 2016 | $8,770 | $485,600 | $322,000 | $163,600 |
| 2015 | $9,725 | $503,900 | $367,000 | $136,900 |
| 2014 | $9,529 | $503,900 | $367,000 | $136,900 |
Source: Public Records
Map
Nearby Homes
- 1 2nd St
- 4 Rogers Ave
- 497 Shore Acres Ave
- 30 2nd St
- 475 Shore Acres Ave
- 14 Rogers Ave
- 505 Shore Acres Ave
- 515 Shore Acres Ave
- 44 2nd St
- 465 Shore Acres Ave
- 521 Shore Acres Ave
- 506 Shore Acres Ave
- 52 2nd St
- 527 Shore Acres Ave
- 59 2nd St
- 533 Shore Acres Ave
- 60 2nd St
- 54 2nd St
- 466 Shore Acres Ave
- 526 Shore Acres Ave