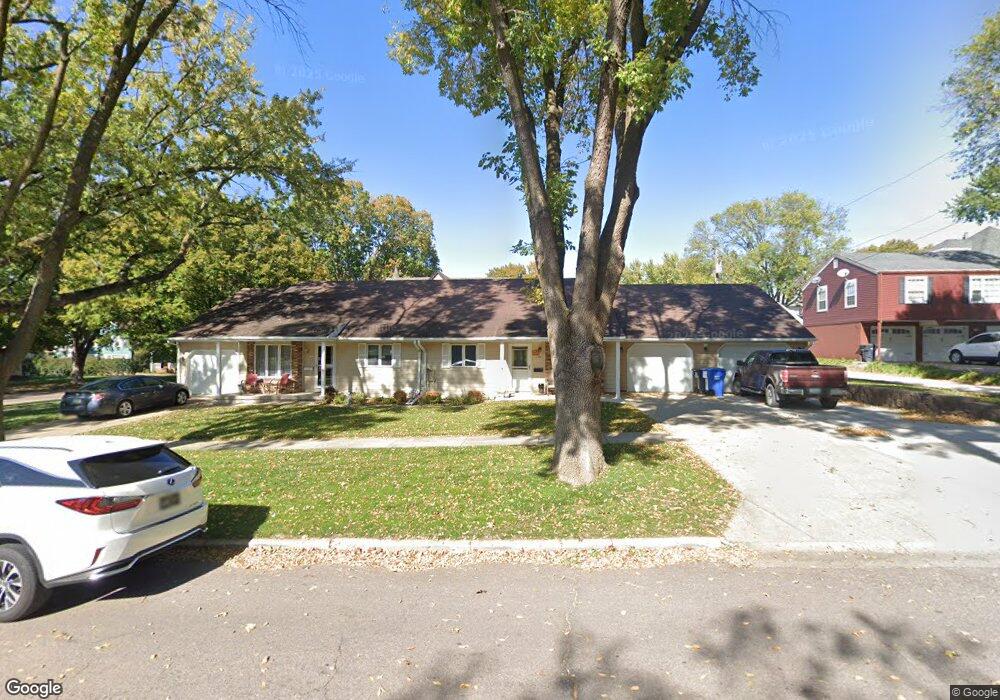
11 6th St SE Unit B Le Mars, IA 51031
Estimated Value: $239,652 - $246,000
2
Beds
2
Baths
1,240
Sq Ft
$196/Sq Ft
Est. Value
About This Home
This home is located at 11 6th St SE Unit B, Le Mars, IA 51031 and is currently estimated at $243,163, approximately $196 per square foot. 11 6th St SE Unit B is a home located in Plymouth County with nearby schools including Le Mars High School, Gehlen Catholic Schools, and Gehlen Elementary School.
Ownership History
Date
Name
Owned For
Owner Type
Purchase Details
Closed on
Sep 30, 2015
Sold by
Athens Bradley J and Athens Eric M
Bought by
Kellen Glenn and Kellen Connie
Current Estimated Value
Home Financials for this Owner
Home Financials are based on the most recent Mortgage that was taken out on this home.
Original Mortgage
$105,000
Outstanding Balance
$42,008
Interest Rate
3.91%
Mortgage Type
New Conventional
Estimated Equity
$201,155
Purchase Details
Closed on
Jan 24, 2012
Sold by
Baker Beverlyn K
Bought by
Athens Marion K
Home Financials for this Owner
Home Financials are based on the most recent Mortgage that was taken out on this home.
Original Mortgage
$65,000
Interest Rate
3.91%
Mortgage Type
New Conventional
Purchase Details
Closed on
Jul 14, 2010
Sold by
Vonhagel Esther L
Bought by
Baker Beverlyn K
Home Financials for this Owner
Home Financials are based on the most recent Mortgage that was taken out on this home.
Original Mortgage
$73,500
Interest Rate
4.83%
Mortgage Type
New Conventional
Create a Home Valuation Report for This Property
The Home Valuation Report is an in-depth analysis detailing your home's value as well as a comparison with similar homes in the area
Home Values in the Area
Average Home Value in this Area
Purchase History
| Date | Buyer | Sale Price | Title Company |
|---|---|---|---|
| Kellen Glenn | $140,000 | None Available | |
| Athens Marion K | $119,500 | None Available | |
| Baker Beverlyn K | $113,500 | None Available |
Source: Public Records
Mortgage History
| Date | Status | Borrower | Loan Amount |
|---|---|---|---|
| Open | Kellen Glenn | $105,000 | |
| Previous Owner | Athens Marion K | $65,000 | |
| Previous Owner | Baker Beverlyn K | $73,500 |
Source: Public Records
Tax History
| Year | Tax Paid | Tax Assessment Tax Assessment Total Assessment is a certain percentage of the fair market value that is determined by local assessors to be the total taxable value of land and additions on the property. | Land | Improvement |
|---|---|---|---|---|
| 2025 | $2,560 | $235,410 | $14,780 | $220,630 |
| 2024 | $2,490 | $211,980 | $14,780 | $197,200 |
| 2023 | $2,406 | $212,210 | $9,850 | $202,360 |
| 2022 | $2,380 | $171,470 | $9,850 | $161,620 |
| 2021 | $2,300 | $171,470 | $9,850 | $161,620 |
| 2020 | $2,300 | $158,060 | $9,850 | $148,210 |
Source: Public Records
Map
Nearby Homes
- 603 2nd Ave SE Unit 2
- 125 9th St SW
- 334 3rd Ave SE
- 401 3rd Ave SW Unit 4
- 1009 1st Ave SE
- 103 3rd Ave SW Unit 1
- 435 N Lynn Dr
- 309 1st St SE
- 811 E Valley Dr
- 610 4th St SW
- 400 Plymouth St SE
- 414 Plymouth St SE
- 1231 2nd Ave SW
- 10 7th Ave SE
- 559 Southview Dr SE
- 570 Loreta Ln
- 135 6th Ave NE
- 1335 4th Ave SE Unit 101
- 26 9th Ave SE
- 533 12th Ave SW
- 11 6th St SE Unit A
- 11 6th St SE
- 514 Central Ave SE
- 531 1st Ave SE
- 521 1st Ave SE
- 508 Central Ave SE
- 515 1st Ave SE
- 521 Central Ave SW
- 531 Central Ave SW
- 500 Central Ave SE
- 509 1st Ave SE
- 515 Central Ave SW
- 501 Central Ave SW
- 501 1st Ave SE
- 611 Central Ave SW
- 530 1st Ave SE
- 520 1st Ave SE
- 530 1st Ave SW
- 520 1st Ave SW
- 514 1st Ave SE
Your Personal Tour Guide
Ask me questions while you tour the home.