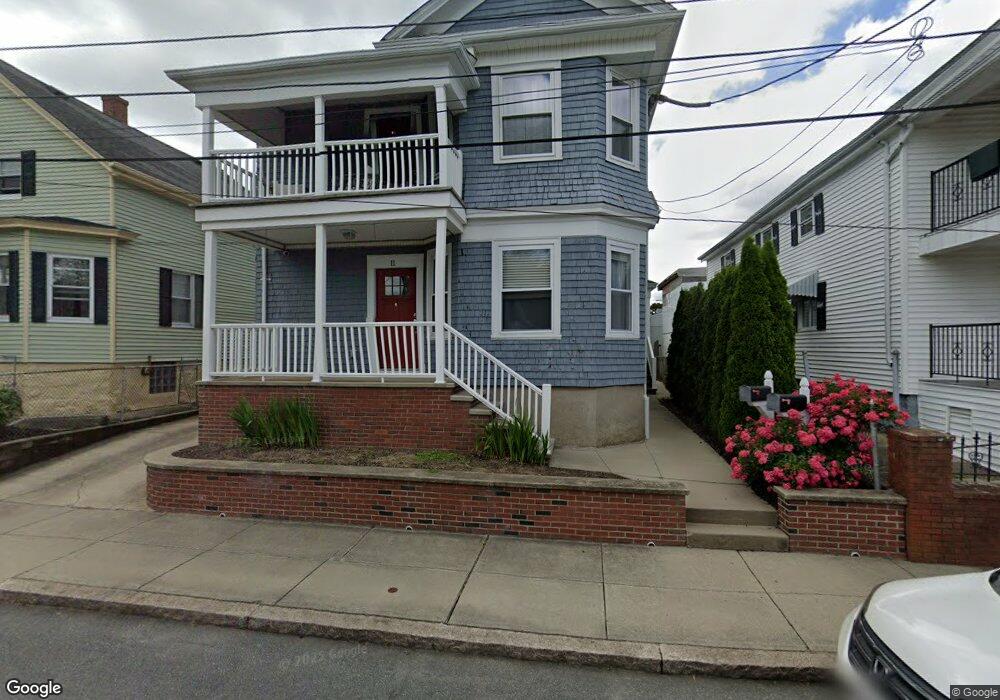
11 Ada St Unit 2 Fall River, MA 02721
Niagara NeighborhoodEstimated Value: $491,341 - $600,000
3
Beds
1
Bath
1,200
Sq Ft
$469/Sq Ft
Est. Value
About This Home
This home is located at 11 Ada St Unit 2, Fall River, MA 02721 and is currently estimated at $562,585, approximately $468 per square foot. 11 Ada St Unit 2 is a home located in Bristol County with nearby schools including William S Greene, Talbot Innovation School, and B M C Durfee High School.
Ownership History
Date
Name
Owned For
Owner Type
Purchase Details
Closed on
Mar 8, 2000
Sold by
Ada Rt
Bought by
Albernaz Jose P and Albernaz Maria J
Current Estimated Value
Home Financials for this Owner
Home Financials are based on the most recent Mortgage that was taken out on this home.
Original Mortgage
$60,000
Outstanding Balance
$20,174
Interest Rate
8.18%
Mortgage Type
Purchase Money Mortgage
Estimated Equity
$542,411
Create a Home Valuation Report for This Property
The Home Valuation Report is an in-depth analysis detailing your home's value as well as a comparison with similar homes in the area
Home Values in the Area
Average Home Value in this Area
Purchase History
| Date | Buyer | Sale Price | Title Company |
|---|---|---|---|
| Albernaz Jose P | $125,000 | -- |
Source: Public Records
Mortgage History
| Date | Status | Borrower | Loan Amount |
|---|---|---|---|
| Open | Albernaz Jose P | $60,000 |
Source: Public Records
Tax History
| Year | Tax Paid | Tax Assessment Tax Assessment Total Assessment is a certain percentage of the fair market value that is determined by local assessors to be the total taxable value of land and additions on the property. | Land | Improvement |
|---|---|---|---|---|
| 2025 | $5,679 | $496,000 | $106,400 | $389,600 |
| 2024 | $5,196 | $452,200 | $102,500 | $349,700 |
| 2023 | $4,637 | $377,900 | $84,600 | $293,300 |
| 2022 | $4,284 | $339,500 | $80,600 | $258,900 |
| 2021 | $3,930 | $284,200 | $76,700 | $207,500 |
| 2020 | $3,503 | $242,400 | $75,600 | $166,800 |
| 2019 | $3,320 | $227,700 | $72,800 | $154,900 |
| 2018 | $3,219 | $220,200 | $78,800 | $141,400 |
| 2017 | $2,759 | $197,100 | $75,100 | $122,000 |
| 2016 | $2,359 | $173,100 | $79,900 | $93,200 |
| 2015 | $2,330 | $178,100 | $79,900 | $98,200 |
| 2014 | $2,321 | $184,500 | $77,600 | $106,900 |
Source: Public Records
Map
Nearby Homes
Your Personal Tour Guide
Ask me questions while you tour the home.