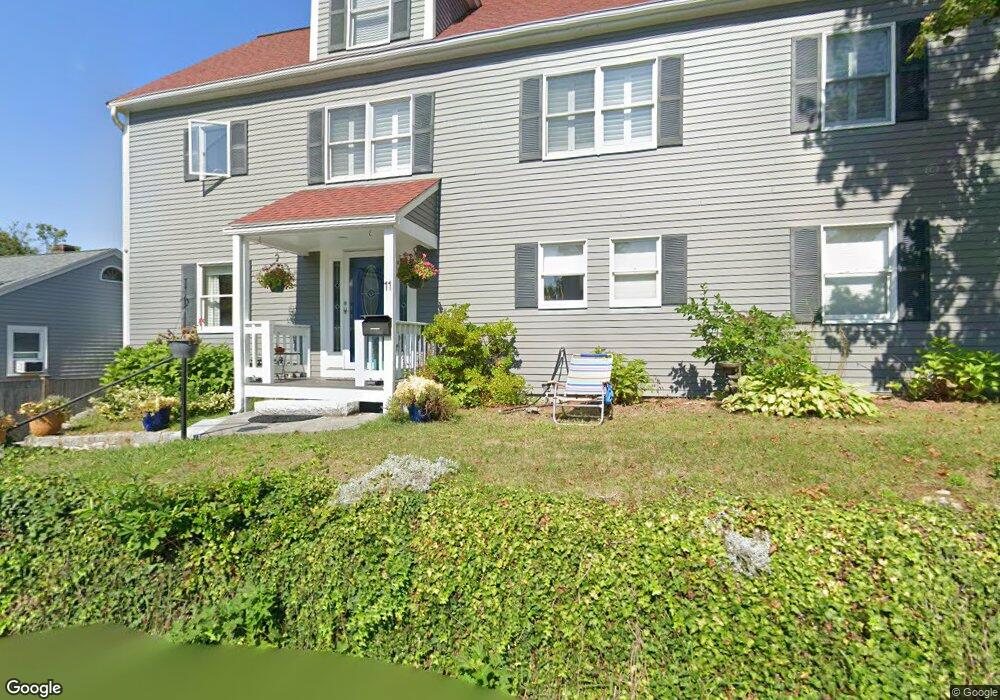
11 Allen Ave Unit 3 Manchester, MA 01944
Estimated Value: $560,779 - $702,000
2
Beds
2
Baths
1,230
Sq Ft
$512/Sq Ft
Est. Value
About This Home
This home is located at 11 Allen Ave Unit 3, Manchester, MA 01944 and is currently estimated at $629,945, approximately $512 per square foot. 11 Allen Ave Unit 3 is a home located in Essex County with nearby schools including Manchester Essex Regional High School, Tara Montessori School, and Glen Urquhart School.
Ownership History
Date
Name
Owned For
Owner Type
Purchase Details
Closed on
May 30, 2003
Sold by
Deoreo Daniel J and Deoreo Sara M
Bought by
Krohn Donna M
Current Estimated Value
Home Financials for this Owner
Home Financials are based on the most recent Mortgage that was taken out on this home.
Original Mortgage
$236,800
Interest Rate
5.86%
Mortgage Type
Purchase Money Mortgage
Purchase Details
Closed on
Jun 22, 2000
Sold by
Kiley-Kaminski Ellen
Bought by
Deoreo Daniel J
Home Financials for this Owner
Home Financials are based on the most recent Mortgage that was taken out on this home.
Original Mortgage
$176,000
Interest Rate
8.48%
Mortgage Type
Purchase Money Mortgage
Purchase Details
Closed on
Apr 29, 1994
Sold by
Dibenedetto Elaine
Bought by
Kaminski Ellen
Purchase Details
Closed on
Apr 28, 1992
Sold by
Dibenedetto Elaine L
Bought by
Dibenedetto Elaine L
Create a Home Valuation Report for This Property
The Home Valuation Report is an in-depth analysis detailing your home's value as well as a comparison with similar homes in the area
Home Values in the Area
Average Home Value in this Area
Purchase History
| Date | Buyer | Sale Price | Title Company |
|---|---|---|---|
| Krohn Donna M | $296,000 | -- | |
| Deoreo Daniel J | $220,000 | -- | |
| Kaminski Ellen | $137,200 | -- | |
| Dibenedetto Elaine L | $115,000 | -- |
Source: Public Records
Mortgage History
| Date | Status | Borrower | Loan Amount |
|---|---|---|---|
| Open | Dibenedetto Elaine L | $210,000 | |
| Closed | Dibenedetto Elaine L | $236,800 | |
| Previous Owner | Dibenedetto Elaine L | $176,000 |
Source: Public Records
Tax History Compared to Growth
Tax History
| Year | Tax Paid | Tax Assessment Tax Assessment Total Assessment is a certain percentage of the fair market value that is determined by local assessors to be the total taxable value of land and additions on the property. | Land | Improvement |
|---|---|---|---|---|
| 2025 | $4,109 | $449,100 | $0 | $449,100 |
| 2024 | $3,790 | $405,300 | $0 | $405,300 |
| 2023 | $3,985 | $382,100 | $0 | $382,100 |
| 2022 | $3,963 | $373,900 | $0 | $373,900 |
| 2021 | $3,968 | $361,100 | $0 | $361,100 |
| 2020 | $2,989 | $255,500 | $0 | $255,500 |
| 2019 | $2,883 | $256,700 | $0 | $256,700 |
| 2018 | $2,831 | $256,700 | $0 | $256,700 |
| 2017 | $2,824 | $256,700 | $0 | $256,700 |
| 2016 | $2,952 | $266,700 | $0 | $266,700 |
| 2015 | $2,916 | $269,000 | $0 | $269,000 |
Source: Public Records
Map
Nearby Homes
- 56 Summer St Unit A
- 27 Norwood Ave Unit C
- 12 Vine St
- 6 Summer St Unit D
- 48 Union St Unit 1
- 2 Mark St
- 9 Masconomo St
- 2 Sky Top Dr
- 30 Pine St
- 4 Windemere Park Extension
- 4 Knight Rd
- 4 Cobb Ave
- 17 Old Essex Rd
- 1 Woodholm Cir
- 35 Forster Rd
- 239 Summer St
- 37 Forster Rd
- 1 Crooked Ln
- 4 Plum Hill Rd
- 214 Summer St