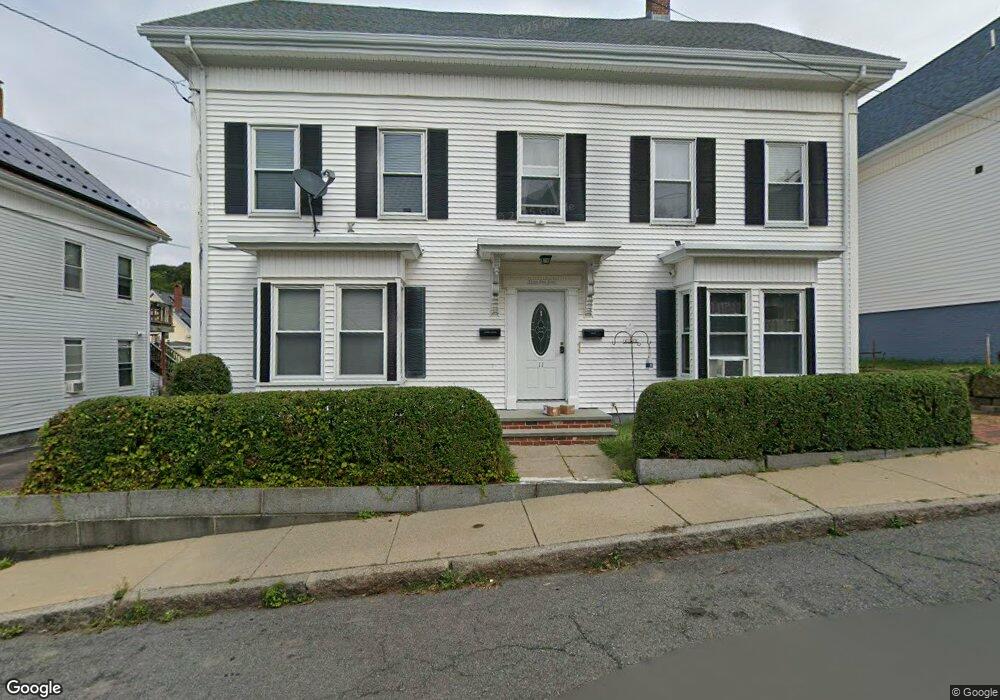
11 Allen St Gloucester, MA 01930
Central Gloucester NeighborhoodEstimated Value: $662,000 - $751,000
5
Beds
3
Baths
2,558
Sq Ft
$282/Sq Ft
Est. Value
About This Home
This home is located at 11 Allen St, Gloucester, MA 01930 and is currently estimated at $720,641, approximately $281 per square foot. 11 Allen St is a home located in Essex County with nearby schools including East Veterans Memorial Elementary, Ralph B O'maley Middle School, and Gloucester High School.
Ownership History
Date
Name
Owned For
Owner Type
Purchase Details
Closed on
Mar 3, 2014
Sold by
Scola John B and Scola Vincie
Bought by
Quince John S and Quince Angela
Current Estimated Value
Purchase Details
Closed on
Aug 18, 2003
Sold by
Westlund Andrea J Est
Bought by
Quince John S and Quince Angela
Home Financials for this Owner
Home Financials are based on the most recent Mortgage that was taken out on this home.
Original Mortgage
$328,860
Interest Rate
5.46%
Mortgage Type
Purchase Money Mortgage
Create a Home Valuation Report for This Property
The Home Valuation Report is an in-depth analysis detailing your home's value as well as a comparison with similar homes in the area
Home Values in the Area
Average Home Value in this Area
Purchase History
| Date | Buyer | Sale Price | Title Company |
|---|---|---|---|
| Quince John S | -- | -- | |
| Quince John S | $359,000 | -- |
Source: Public Records
Mortgage History
| Date | Status | Borrower | Loan Amount |
|---|---|---|---|
| Previous Owner | Quince John S | $8,500 | |
| Previous Owner | Quince John S | $328,860 | |
| Previous Owner | Quince John S | $20,035 |
Source: Public Records
Tax History
| Year | Tax Paid | Tax Assessment Tax Assessment Total Assessment is a certain percentage of the fair market value that is determined by local assessors to be the total taxable value of land and additions on the property. | Land | Improvement |
|---|---|---|---|---|
| 2025 | $6,231 | $641,000 | $137,400 | $503,600 |
| 2024 | $6,128 | $629,800 | $130,900 | $498,900 |
| 2023 | $6,347 | $599,300 | $116,900 | $482,400 |
| 2022 | $5,937 | $506,100 | $101,600 | $404,500 |
| 2021 | $5,741 | $461,500 | $92,400 | $369,100 |
| 2020 | $5,428 | $440,200 | $92,400 | $347,800 |
| 2019 | $5,018 | $395,400 | $92,400 | $303,000 |
| 2018 | $4,655 | $360,000 | $92,400 | $267,600 |
| 2017 | $4,378 | $331,900 | $83,200 | $248,700 |
| 2016 | $4,171 | $306,500 | $83,200 | $223,300 |
| 2015 | $4,088 | $299,500 | $83,200 | $216,300 |
Source: Public Records
Map
Nearby Homes
- 50 Warner St
- 139A Prospect St
- 113 Pleasant St
- 19 Trask St Unit 2
- 33 Maplewood Ave Unit 310
- 191 Main St Unit 3
- 191 Main St Unit 2A
- 40 Sargent St
- 12 Arthur St
- 9 Cleveland Place
- 35 Middle St Unit 4
- 33 Middle St
- 120 Washington St
- 98 Maplewood Ave
- 36 Eastern Ave
- 20 Beacon St
- 20 Beacon St Unit 2
- 20 Beacon St Unit 1
- 8 Mystic Ave
- 13 Mystic Ave
Your Personal Tour Guide
Ask me questions while you tour the home.