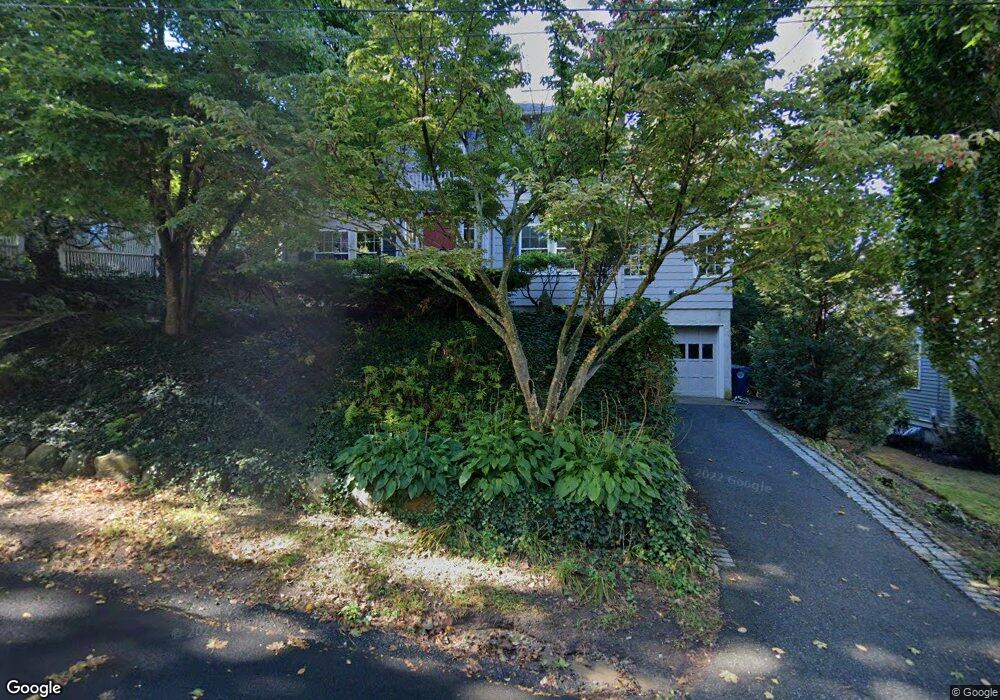
11 Allston St West Newton, MA 02465
West Newton NeighborhoodEstimated Value: $1,140,000 - $1,516,000
3
Beds
3
Baths
1,736
Sq Ft
$736/Sq Ft
Est. Value
About This Home
This home is located at 11 Allston St, West Newton, MA 02465 and is currently estimated at $1,277,747, approximately $736 per square foot. 11 Allston St is a home located in Middlesex County with nearby schools including Cabot Elementary School, F.A. Day Middle School, and Newton North High School.
Ownership History
Date
Name
Owned For
Owner Type
Purchase Details
Closed on
Mar 25, 2025
Sold by
Bryer Mantak Ft and Bryer
Bought by
John F Bryer T F and John Bryre
Current Estimated Value
Purchase Details
Closed on
Jul 23, 2015
Sold by
Mantak Diane L and Bryer John G
Bought by
Bryermantak Ft and Mantak Diane L
Create a Home Valuation Report for This Property
The Home Valuation Report is an in-depth analysis detailing your home's value as well as a comparison with similar homes in the area
Home Values in the Area
Average Home Value in this Area
Purchase History
| Date | Buyer | Sale Price | Title Company |
|---|---|---|---|
| John F Bryer T F | -- | None Available | |
| Bryermantak Ft | -- | -- |
Source: Public Records
Tax History Compared to Growth
Tax History
| Year | Tax Paid | Tax Assessment Tax Assessment Total Assessment is a certain percentage of the fair market value that is determined by local assessors to be the total taxable value of land and additions on the property. | Land | Improvement |
|---|---|---|---|---|
| 2025 | $8,907 | $908,900 | $871,600 | $37,300 |
| 2024 | $8,612 | $882,400 | $846,200 | $36,200 |
| 2023 | $8,263 | $811,700 | $677,800 | $133,900 |
| 2022 | $7,907 | $751,600 | $627,600 | $124,000 |
| 2021 | $7,419 | $689,500 | $575,800 | $113,700 |
| 2020 | $7,198 | $689,500 | $575,800 | $113,700 |
| 2019 | $6,734 | $644,400 | $538,100 | $106,300 |
| 2018 | $6,767 | $625,400 | $511,400 | $114,000 |
| 2017 | $6,381 | $573,800 | $469,200 | $104,600 |
| 2016 | $5,990 | $526,400 | $430,500 | $95,900 |
| 2015 | $5,712 | $492,000 | $402,300 | $89,700 |
Source: Public Records
Map
Nearby Homes
- 123 Mount Vernon St Unit 2
- 140 Mount Vernon St
- 4 Wiswall St
- 12 Wiswall St
- 33 Birch Hill Rd
- 27 Cross St Unit 27
- 20 Birch Hill Rd
- 935 Washington St (Rear Facing) Unit 11
- 935 Washington St Unit 8
- 318 Austin St Unit A
- 4 Hosmer Cir
- 43 Walker St
- 911 Washington St
- 22 Walnut Place Unit 1
- 321 Albemarle Rd
- 32-34 Rossmere St
- 299 Albemarle Rd
- 79 Chestnut St Unit 2
- 168 Walnut St
- 611 Watertown St Unit 14
- 5 Allston St Unit 5
- 5 Allston St
- 151 Mount Vernon St
- 35 Allston St
- 3 Allston St
- 204 Austin St
- 210 Austin St
- 8-10 Allston St
- 10 Allston St
- 10 Allston St Unit 1
- 159 Mount Vernon St
- 8 Allston St Unit 10
- 8 Allston St Unit Second Floor
- 8 Allston St
- 8 Allston St Unit 2
- 139 Mount Vernon St
- 4 Allston St
- 216 Austin St
- 133 Mt Vernon St Unit 2
- 131 Mt Vernon St Unit 1