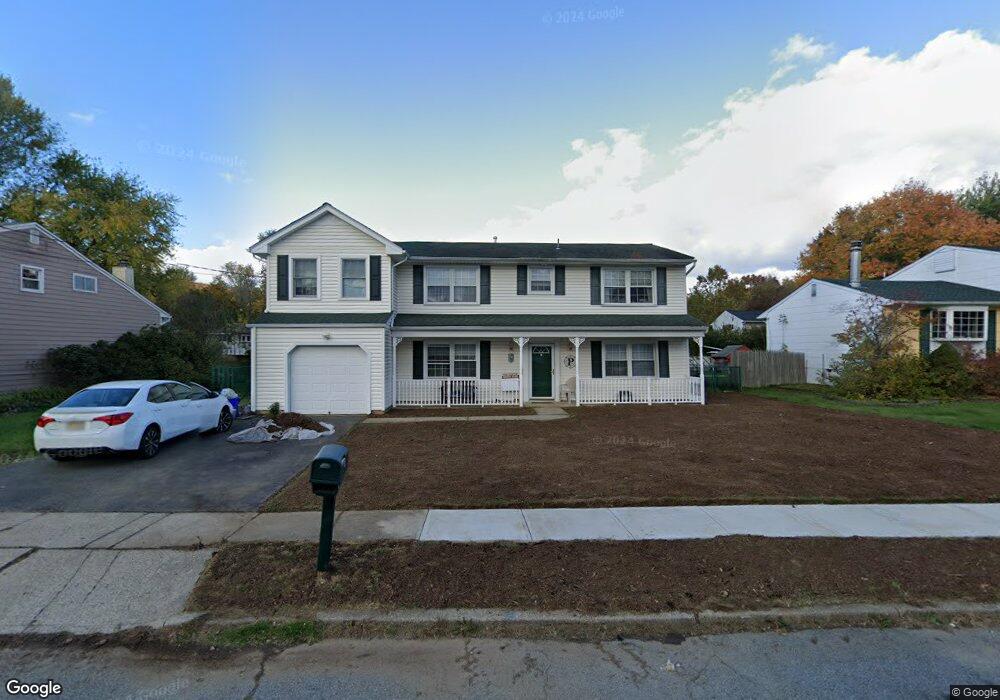
11 Allyson Rd Flanders, NJ 07836
Estimated Value: $549,000 - $622,000
--
Bed
--
Bath
2,637
Sq Ft
$222/Sq Ft
Est. Value
About This Home
This home is located at 11 Allyson Rd, Flanders, NJ 07836 and is currently estimated at $586,721, approximately $222 per square foot. 11 Allyson Rd is a home located in Morris County with nearby schools including Mt Olive Middle School, Mount Olive High School, and American Christian School.
Ownership History
Date
Name
Owned For
Owner Type
Purchase Details
Closed on
Apr 13, 2000
Sold by
Cohen Fred and Cohen Sheila I
Bought by
Paspalas Alexander T and Paspalas Jeanni L
Current Estimated Value
Home Financials for this Owner
Home Financials are based on the most recent Mortgage that was taken out on this home.
Original Mortgage
$50,000
Outstanding Balance
$17,105
Interest Rate
8.21%
Mortgage Type
Stand Alone Second
Estimated Equity
$569,616
Create a Home Valuation Report for This Property
The Home Valuation Report is an in-depth analysis detailing your home's value as well as a comparison with similar homes in the area
Home Values in the Area
Average Home Value in this Area
Purchase History
| Date | Buyer | Sale Price | Title Company |
|---|---|---|---|
| Paspalas Alexander T | $205,000 | Lawyers Title Insurance Corp |
Source: Public Records
Mortgage History
| Date | Status | Borrower | Loan Amount |
|---|---|---|---|
| Open | Paspalas Alexander T | $50,000 | |
| Open | Paspalas Alexander T | $134,500 |
Source: Public Records
Tax History Compared to Growth
Tax History
| Year | Tax Paid | Tax Assessment Tax Assessment Total Assessment is a certain percentage of the fair market value that is determined by local assessors to be the total taxable value of land and additions on the property. | Land | Improvement |
|---|---|---|---|---|
| 2025 | $11,424 | $327,800 | $172,700 | $155,100 |
| 2024 | $10,775 | $327,800 | $172,700 | $155,100 |
| 2023 | $10,775 | $327,800 | $172,700 | $155,100 |
| 2022 | $11,008 | $327,800 | $172,700 | $155,100 |
| 2021 | $11,008 | $327,800 | $172,700 | $155,100 |
| 2020 | $10,860 | $327,800 | $172,700 | $155,100 |
| 2019 | $9,939 | $301,000 | $172,700 | $128,300 |
| 2018 | $9,843 | $301,000 | $172,700 | $128,300 |
| 2017 | $9,671 | $301,000 | $172,700 | $128,300 |
| 2016 | $9,364 | $301,000 | $172,700 | $128,300 |
| 2015 | $9,584 | $301,000 | $172,700 | $128,300 |
| 2014 | $9,593 | $301,000 | $172,700 | $128,300 |
Source: Public Records
Map
Nearby Homes
- 150 Clover Hill Dr
- 6 Ironia Rd
- 7 Grant Ct
- 19 Park Place
- 57 Clover Hill Dr
- 4 Mill Rd
- 23 Hillside Ave
- 45 Deer Path Dr
- 6 Mountain Ave
- 15 Deer Path Dr
- 6 Cornell Dr
- 209 Pleasant Hill Rd
- 72 Flanders Drakestown Rd
- 150 U S Highway 206
- 221 Pleasant Hill Rd
- 15 Prides Crossing
- 532 Drakestown Rd
- 8 Delwood Rd
- 146 U S Highway 206
- 6 Perin Place