
Seller's Agent in 2025
Nancy Peterson
J. Barrett & Company
(978) 922-3683
4 in this area
66 Total Sales
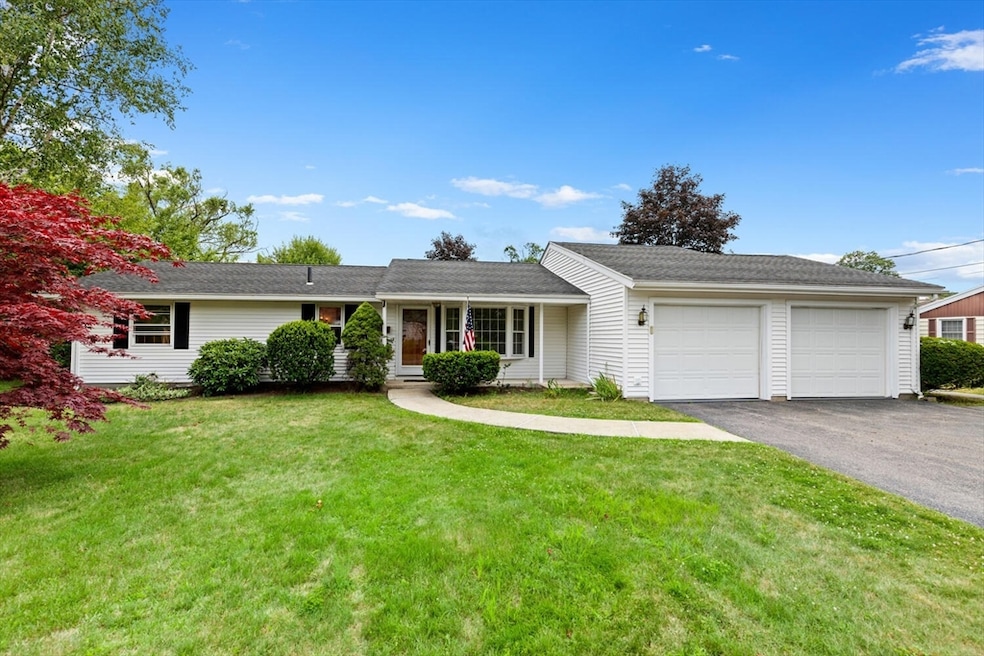
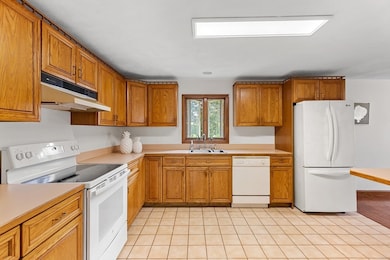
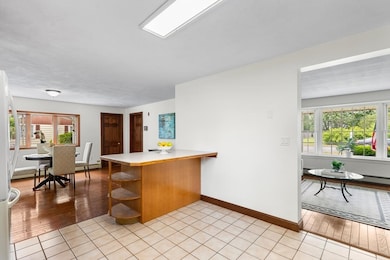
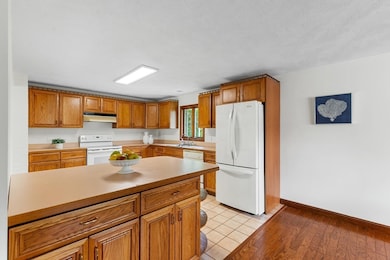
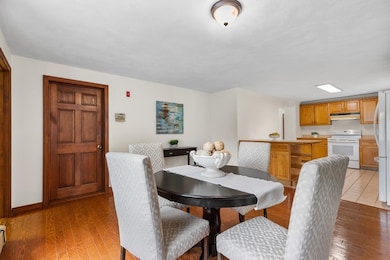
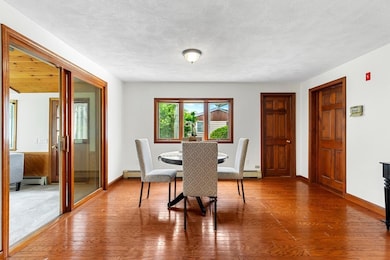
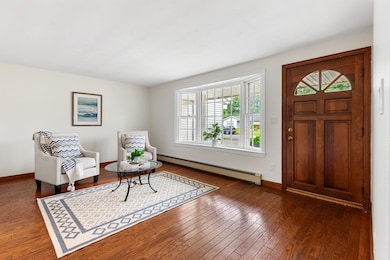
Enjoy the best of so many worlds: a spacious move-in ready home in a great Danvers neighborhood (Woodvale) with options to make this your forever home. This 3-bedroom (including en-suite primary), 2-bath, 1,600 sf Ranch with an oversized 2-car garage features a large living-dining room with hardwood flooring open to the generous kitchen with a large peninsula. The even larger family room has a charming architectural ceiling. Add sliders for easy access to a large flat yard with 2 sheds and ample space for gardens, patio or pool - create your own outdoor paradise. Update the kitchen and bathrooms and this well-maintained classic will be the envy of friends and neighbors. Location is a bonus. In addition to convenient access to major highways, shops and restaurants, this home is within a half mile of Danvers’ highly rated elementary, middle and high schools. First-time buyers or downsizers, opportunity is calling. Come claim this beauty soon!
Last Buyer's Agent
Michael Palleschi
Cameron Real Estate Group
| Date | Type | Sale Price | Title Company |
|---|---|---|---|
| Quit Claim Deed | $700,000 | -- | |
| Quit Claim Deed | $700,000 | -- | |
| Quit Claim Deed | -- | None Available | |
| Quit Claim Deed | -- | None Available | |
| Deed | $172,000 | -- | |
| Deed | $172,000 | -- | |
| Deed | $207,000 | -- | |
| Deed | $207,000 | -- |
| Date | Status | Loan Amount | Loan Type |
|---|---|---|---|
| Previous Owner | $25,000 | No Value Available | |
| Previous Owner | $25,000 | No Value Available | |
| Previous Owner | $120,000 | Purchase Money Mortgage |
| Date | Event | Price | List to Sale | Price per Sq Ft |
|---|---|---|---|---|
| 08/29/2025 08/29/25 | Sold | $700,000 | +4.6% | $437 / Sq Ft |
| 07/15/2025 07/15/25 | Pending | -- | -- | -- |
| 07/08/2025 07/08/25 | For Sale | $669,000 | -- | $418 / Sq Ft |
| Year | Tax Paid | Tax Assessment Tax Assessment Total Assessment is a certain percentage of the fair market value that is determined by local assessors to be the total taxable value of land and additions on the property. | Land | Improvement |
|---|---|---|---|---|
| 2025 | $6,609 | $601,400 | $386,100 | $215,300 |
| 2024 | $6,570 | $591,400 | $386,100 | $205,300 |
| 2023 | $6,401 | $544,800 | $350,900 | $193,900 |
| 2022 | $6,265 | $494,900 | $318,500 | $176,400 |
| 2021 | $6,016 | $450,600 | $301,700 | $148,900 |
| 2020 | $5,924 | $453,600 | $298,200 | $155,400 |
| 2019 | $5,665 | $426,600 | $271,200 | $155,400 |
| 2018 | $5,512 | $407,100 | $268,500 | $138,600 |
| 2017 | $5,270 | $371,400 | $234,800 | $136,600 |
| 2016 | $5,028 | $354,100 | $224,000 | $130,100 |
| 2015 | $4,791 | $321,300 | $203,700 | $117,600 |
Seller's Agent in 2025
Nancy Peterson
J. Barrett & Company
(978) 922-3683
4 in this area
66 Total Sales
M
Buyer's Agent in 2025
Michael Palleschi
Cameron Real Estate Group
Source: MLS Property Information Network (MLS PIN)
MLS Number: 73401082
APN: DANV-000036-000000-000159
Disclaimer: Certain information contained herein is derived from information provided by parties other than Homes.com. All information provided is deemed reliable, but is not guaranteed to be accurate and should be independently verified.
![]() The property listing data and information, or the Images, set forth herein were provided to MLS Property Information Network, Inc. from third party sources, including sellers, lessors and public records, and were compiled by MLS Property Information Network, Inc. The property listing data and information, and the Images, are for the personal, non-commercial use of consumers having a good faith interest in purchasing or leasing listed properties of the type displayed to them and may not be used for any purpose other than to identify prospective properties which such consumers may have a good faith interest in purchasing or leasing. MLS Property Information Network, Inc. and its subscribers disclaim any and all representations and warranties as to the accuracy of the property listing data and information, or as to the accuracy of any of the Images, set forth herein.
The property listing data and information, or the Images, set forth herein were provided to MLS Property Information Network, Inc. from third party sources, including sellers, lessors and public records, and were compiled by MLS Property Information Network, Inc. The property listing data and information, and the Images, are for the personal, non-commercial use of consumers having a good faith interest in purchasing or leasing listed properties of the type displayed to them and may not be used for any purpose other than to identify prospective properties which such consumers may have a good faith interest in purchasing or leasing. MLS Property Information Network, Inc. and its subscribers disclaim any and all representations and warranties as to the accuracy of the property listing data and information, or as to the accuracy of any of the Images, set forth herein.
Ask me questions while you tour the home.