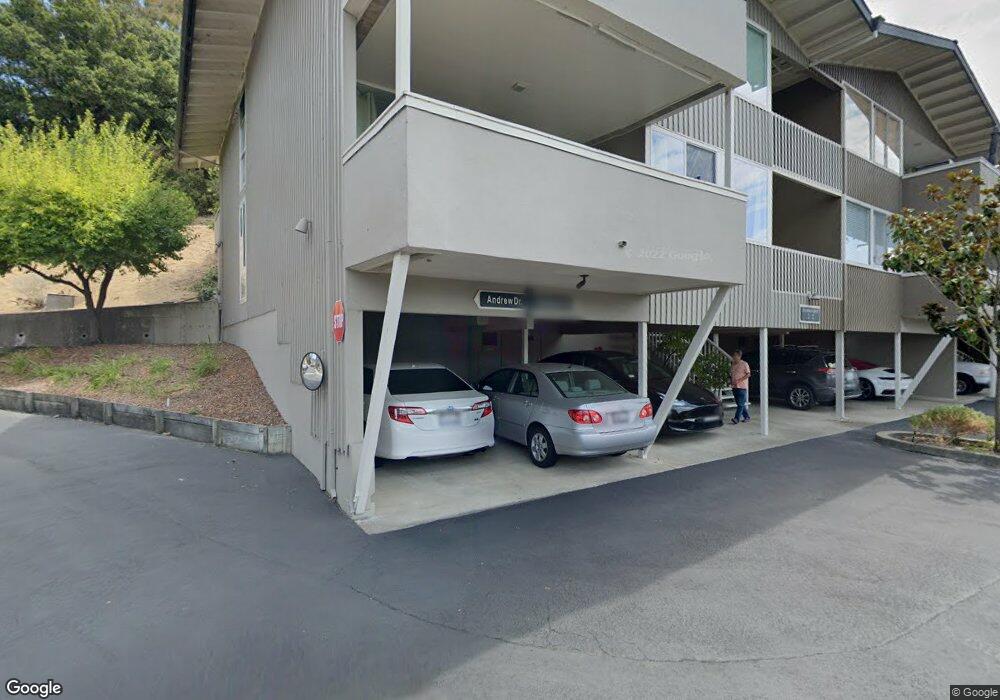
11 Andrew Dr Unit 39 Belvedere Tiburon, CA 94920
Estimated Value: $459,000 - $961,000
3
Beds
2
Baths
1,235
Sq Ft
$626/Sq Ft
Est. Value
About This Home
This home is located at 11 Andrew Dr Unit 39, Belvedere Tiburon, CA 94920 and is currently estimated at $773,698, approximately $626 per square foot. 11 Andrew Dr Unit 39 is a home located in Marin County with nearby schools including Bel Aire Elementary School, Reed Elementary School, and Del Mar Middle School.
Ownership History
Date
Name
Owned For
Owner Type
Purchase Details
Closed on
Apr 28, 2010
Sold by
Shine Alva A
Bought by
Shine Alva A
Current Estimated Value
Purchase Details
Closed on
Dec 31, 2002
Sold by
Shine Dennis K and Shine Alva A
Bought by
Shine Dennis K and Shine Alva A
Purchase Details
Closed on
Oct 29, 1996
Sold by
Margaret Filante
Bought by
Shine Dennis and Shine Alva
Home Financials for this Owner
Home Financials are based on the most recent Mortgage that was taken out on this home.
Original Mortgage
$84,000
Outstanding Balance
$8,293
Interest Rate
8.11%
Estimated Equity
$765,405
Purchase Details
Closed on
Jun 6, 1995
Sold by
Filante Margaret S
Bought by
Filante Margaret
Create a Home Valuation Report for This Property
The Home Valuation Report is an in-depth analysis detailing your home's value as well as a comparison with similar homes in the area
Home Values in the Area
Average Home Value in this Area
Purchase History
| Date | Buyer | Sale Price | Title Company |
|---|---|---|---|
| Shine Alva A | -- | None Available | |
| Shine Dennis K | -- | -- | |
| Shine Dennis | $110,909 | California Land Title Co | |
| Filante Margaret | -- | -- |
Source: Public Records
Mortgage History
| Date | Status | Borrower | Loan Amount |
|---|---|---|---|
| Open | Shine Dennis | $84,000 |
Source: Public Records
Tax History Compared to Growth
Tax History
| Year | Tax Paid | Tax Assessment Tax Assessment Total Assessment is a certain percentage of the fair market value that is determined by local assessors to be the total taxable value of land and additions on the property. | Land | Improvement |
|---|---|---|---|---|
| 2025 | $7,561 | $463,613 | $209,334 | $254,279 |
| 2024 | $7,561 | $454,525 | $205,230 | $249,295 |
| 2023 | $7,451 | $445,613 | $201,206 | $244,407 |
| 2022 | $7,355 | $436,878 | $197,262 | $239,616 |
| 2021 | $7,248 | $428,313 | $193,395 | $234,918 |
| 2020 | $7,178 | $423,923 | $191,413 | $232,510 |
| 2019 | $6,933 | $415,614 | $187,661 | $227,953 |
| 2018 | $6,331 | $407,466 | $183,982 | $223,484 |
| 2017 | $6,108 | $399,477 | $180,375 | $219,102 |
| 2016 | $5,743 | $391,646 | $176,839 | $214,807 |
| 2015 | $5,593 | $385,764 | $174,183 | $211,581 |
| 2014 | $5,401 | $378,208 | $170,771 | $207,437 |
Source: Public Records
Map
Nearby Homes
- 34 Andrew Dr Unit 135
- 14 Janet Way Unit 151
- 130 Leland Way
- 448 Greenwood Beach Rd
- 472 Irving Ct
- 107 Blackfield Dr
- 27 Strawberry Cir
- 39 Strawberry Cir
- 0 E Strawberry Dr
- 3 Trestle Glen Cir
- 11 Sky Rd
- 136 Belvedere Dr
- 53 Mercury Ave
- 103 Via Los Altos
- 22 Venus Ct
- 9 Clotilda Ct
- 100 Milland Dr
- 25 Mark Terrace
- 124 Mission Dr
- 31 Knoll Ln
- 11 Andrew Dr Unit 40
- 11 Andrew Dr
- 11 Andrew Dr Unit 41
- 15 Andrew Dr Unit 36
- 15 Andrew Dr
- 10 Andrew Dr Unit 60
- 10 Andrew Dr Unit 61
- 10 Andrew Dr
- 10 Andrew Dr
- 10 Andrew Dr
- 19 Andrew Dr Unit 31
- 19 Andrew Dr
- 19 Andrew Dr Unit 32
- 1 Andrew Dr Unit 55
- 1 Andrew Dr Unit 57
- 1 Andrew Dr Unit 56
- 1 Andrew Dr
- 1 Andrew Dr
- 1 Andrew Dr
- 1 Andrew Dr