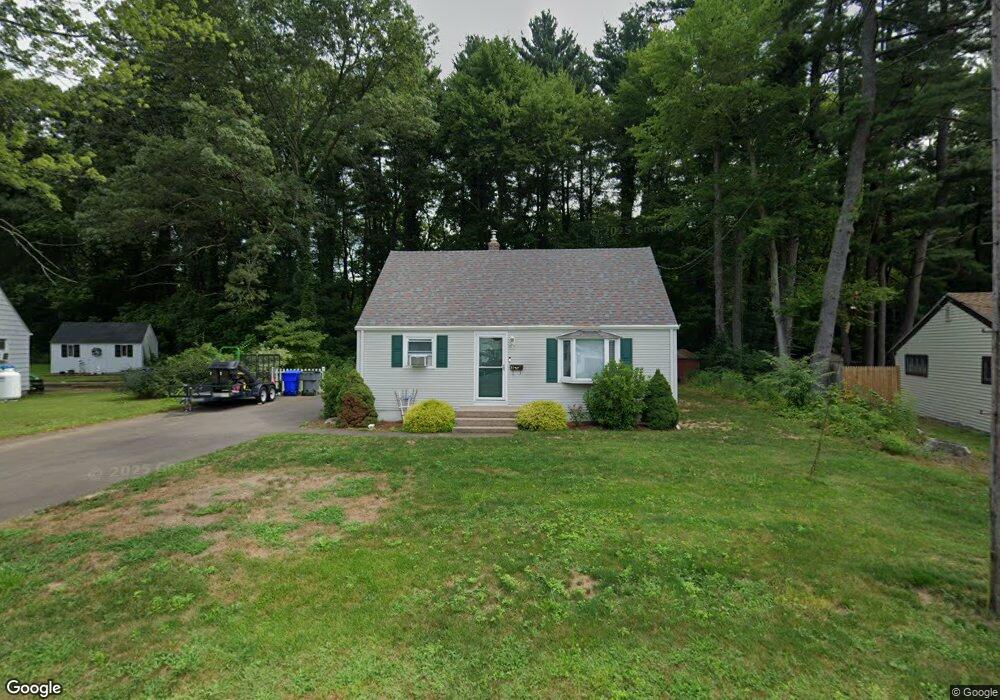
11 Arthur Ave Enfield, CT 06082
Estimated Value: $286,000 - $297,000
3
Beds
1
Bath
1,152
Sq Ft
$253/Sq Ft
Est. Value
About This Home
This home is located at 11 Arthur Ave, Enfield, CT 06082 and is currently estimated at $291,338, approximately $252 per square foot. 11 Arthur Ave is a home located in Hartford County with nearby schools including Prudence Crandall Elementary School, Henry Barnard Elementary School, and Enfield High School.
Ownership History
Date
Name
Owned For
Owner Type
Purchase Details
Closed on
Jul 14, 2022
Sold by
Landmark Rlty Group Llc
Bought by
Roy Kevin M
Current Estimated Value
Home Financials for this Owner
Home Financials are based on the most recent Mortgage that was taken out on this home.
Original Mortgage
$240,405
Outstanding Balance
$227,375
Interest Rate
5.09%
Mortgage Type
Purchase Money Mortgage
Estimated Equity
$63,963
Purchase Details
Closed on
Jun 2, 2022
Sold by
Dodd Barbara and Dodd Robert T
Bought by
Landmark Realty Group Llc
Home Financials for this Owner
Home Financials are based on the most recent Mortgage that was taken out on this home.
Original Mortgage
$240,405
Outstanding Balance
$227,375
Interest Rate
5.09%
Mortgage Type
Purchase Money Mortgage
Estimated Equity
$63,963
Create a Home Valuation Report for This Property
The Home Valuation Report is an in-depth analysis detailing your home's value as well as a comparison with similar homes in the area
Home Values in the Area
Average Home Value in this Area
Purchase History
| Date | Buyer | Sale Price | Title Company |
|---|---|---|---|
| Roy Kevin M | $235,000 | None Available | |
| Landmark Realty Group Llc | $145,000 | None Available |
Source: Public Records
Mortgage History
| Date | Status | Borrower | Loan Amount |
|---|---|---|---|
| Open | Roy Kevin M | $240,405 | |
| Previous Owner | Landmark Realty Group Llc | $140,000 |
Source: Public Records
Tax History
| Year | Tax Paid | Tax Assessment Tax Assessment Total Assessment is a certain percentage of the fair market value that is determined by local assessors to be the total taxable value of land and additions on the property. | Land | Improvement |
|---|---|---|---|---|
| 2025 | $4,428 | $127,800 | $54,000 | $73,800 |
| 2024 | $4,321 | $127,800 | $54,000 | $73,800 |
| 2023 | $4,251 | $127,800 | $54,000 | $73,800 |
| 2022 | $3,909 | $127,800 | $54,000 | $73,800 |
| 2021 | $3,735 | $99,920 | $44,700 | $55,220 |
| 2020 | $3,735 | $99,920 | $44,700 | $55,220 |
| 2019 | $3,735 | $99,920 | $44,700 | $55,220 |
| 2018 | $3,652 | $99,920 | $44,700 | $55,220 |
| 2017 | $3,455 | $99,920 | $44,700 | $55,220 |
| 2016 | $3,624 | $106,550 | $52,740 | $53,810 |
| 2015 | $3,520 | $106,550 | $52,740 | $53,810 |
| 2014 | $3,439 | $106,550 | $52,740 | $53,810 |
Source: Public Records
Map
Nearby Homes
Your Personal Tour Guide
Ask me questions while you tour the home.