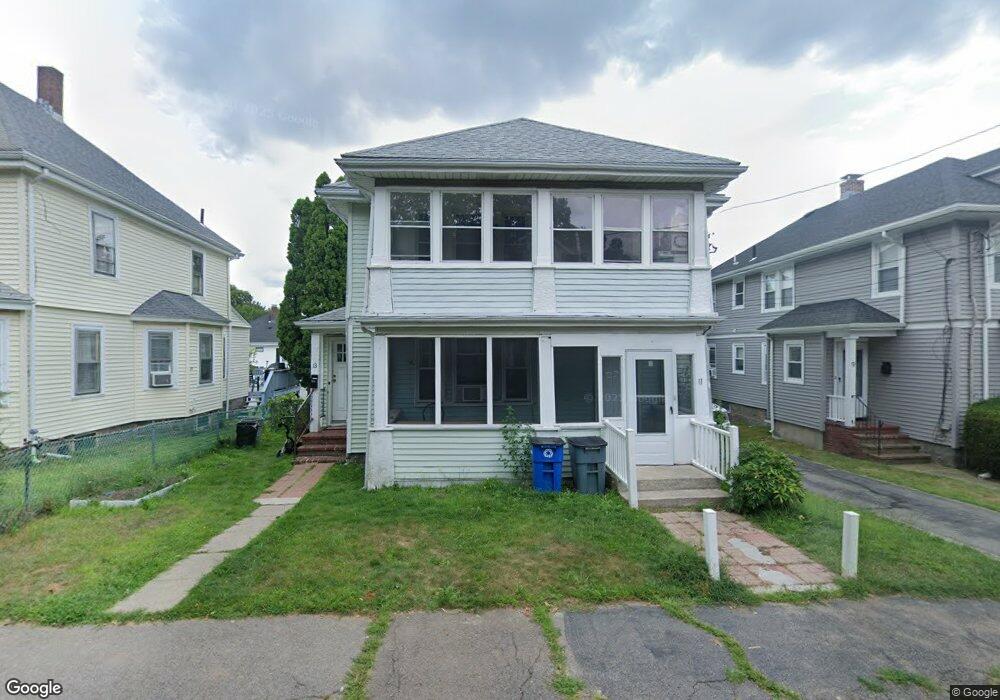
11 Atherton St Quincy, MA 02169
Quincy Point NeighborhoodEstimated Value: $709,000 - $980,000
6
Beds
4
Baths
2,100
Sq Ft
$388/Sq Ft
Est. Value
About This Home
This home is located at 11 Atherton St, Quincy, MA 02169 and is currently estimated at $815,168, approximately $388 per square foot. 11 Atherton St is a home located in Norfolk County with nearby schools including Point Webster Middle School, Clifford H. Marshall Elementary School, and Quincy High School.
Ownership History
Date
Name
Owned For
Owner Type
Purchase Details
Closed on
Mar 19, 2010
Sold by
Deutsche Bank Natl T C
Bought by
Kwong Joel C and Kwong Jenny D
Current Estimated Value
Home Financials for this Owner
Home Financials are based on the most recent Mortgage that was taken out on this home.
Original Mortgage
$225,750
Interest Rate
5.05%
Mortgage Type
Purchase Money Mortgage
Purchase Details
Closed on
Jun 30, 2008
Sold by
Deutsche Bank Natl T C
Bought by
Deutsche Bank Natl T C
Purchase Details
Closed on
Jul 24, 2000
Sold by
Abouzeid Nassim D and Abouzeid Ghada N
Bought by
Ibrahim George C and Ibrahim Marcelle
Purchase Details
Closed on
Sep 21, 1989
Sold by
Peredetto Ernest J
Bought by
Abouzeid Nassim D
Create a Home Valuation Report for This Property
The Home Valuation Report is an in-depth analysis detailing your home's value as well as a comparison with similar homes in the area
Home Values in the Area
Average Home Value in this Area
Purchase History
| Date | Buyer | Sale Price | Title Company |
|---|---|---|---|
| Kwong Joel C | $301,000 | -- | |
| Deutsche Bank Natl T C | $430,000 | -- | |
| Ibrahim George C | $270,000 | -- | |
| Abouzeid Nassim D | $182,000 | -- |
Source: Public Records
Mortgage History
| Date | Status | Borrower | Loan Amount |
|---|---|---|---|
| Open | Abouzeid Nassim D | $221,000 | |
| Closed | Kwong Joel C | $225,750 | |
| Previous Owner | Abouzeid Nassim D | $375,000 |
Source: Public Records
Tax History Compared to Growth
Tax History
| Year | Tax Paid | Tax Assessment Tax Assessment Total Assessment is a certain percentage of the fair market value that is determined by local assessors to be the total taxable value of land and additions on the property. | Land | Improvement |
|---|---|---|---|---|
| 2025 | $8,162 | $707,900 | $268,700 | $439,200 |
| 2024 | $7,684 | $681,800 | $255,900 | $425,900 |
| 2023 | $7,182 | $645,300 | $232,600 | $412,700 |
| 2022 | $7,151 | $596,900 | $211,500 | $385,400 |
| 2021 | $7,276 | $599,300 | $211,500 | $387,800 |
| 2020 | $7,249 | $583,200 | $199,500 | $383,700 |
| 2019 | $6,850 | $545,800 | $184,700 | $361,100 |
| 2018 | $6,151 | $461,100 | $167,900 | $293,200 |
| 2017 | $6,194 | $437,100 | $159,900 | $277,200 |
| 2016 | $5,567 | $387,700 | $145,400 | $242,300 |
| 2015 | $5,352 | $366,600 | $137,100 | $229,500 |
| 2014 | $4,739 | $318,900 | $137,100 | $181,800 |
Source: Public Records
Map
Nearby Homes
- 16 Dartmouth St Unit 16
- 32 Sumner St
- 33 Elm St
- 51 Sumner St
- 19 Keyes St
- 81-85 Water St
- 187 Washington St
- 313 Washington St
- 2 Cliveden St Unit 601E
- 2 Cliveden St Unit 405E
- 166 Phipps St
- 18 Cliveden St Unit 406W
- 18 Cliveden St Unit 201W
- 25 5th Ave
- 106 Washington St Unit 45
- 161 Sumner St Unit 2
- 161 Sumner St Unit 4
- 66 Mcgrath Hwy Unit 407
- 66 Mcgrath Hwy Unit 405
- 66 Mcgrath Hwy Unit 308
- 9 Atherton St
- 7 Atherton St
- 7 Atherton St Unit 1
- 7 Atherton St Unit 9
- 17 Atherton St
- 21 Atherton St
- 18 Berkeley St
- 14 Berkeley St
- 10 Berkeley St
- 10 Berkeley St Unit 1
- 10 Berkeley St Unit 12
- 10-12 Berkeley St Unit 1
- 12 Atherton St
- 22 Berkeley St
- 23 Atherton St
- 23 Atherton St Unit 23
- 1 Atherton St Unit 3
- 1 Atherton St Unit 1B
- 1 Atherton St
- 1 Atherton St Unit 2