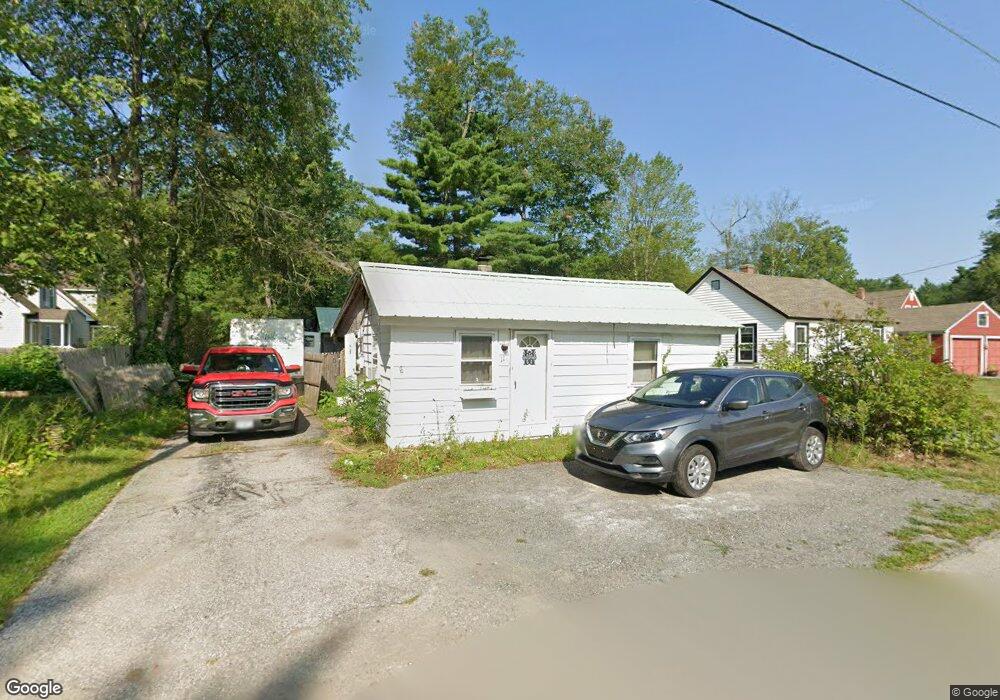
11 Aylward Ave Swanzey, NH 03446
Estimated Value: $132,000 - $185,000
1
Bed
1
Bath
670
Sq Ft
$248/Sq Ft
Est. Value
About This Home
This home is located at 11 Aylward Ave, Swanzey, NH 03446 and is currently estimated at $165,951, approximately $247 per square foot. 11 Aylward Ave is a home located in Cheshire County with nearby schools including Mt. Caesar Elementary School, Cutler School, and Monadnock Regional High School.
Ownership History
Date
Name
Owned For
Owner Type
Purchase Details
Closed on
Sep 22, 2014
Sold by
Hopkins Kristen
Bought by
Hallford Christopher and Hallford Sally
Current Estimated Value
Purchase Details
Closed on
May 7, 2009
Sold by
Fhlmc
Bought by
Bradshaw Andrew and Bradshaw Kristen
Purchase Details
Closed on
Aug 6, 2008
Sold by
Hullinghorst Joni and Hullinghorst Fhlmc
Bought by
Fhlmc
Purchase Details
Closed on
May 9, 2002
Sold by
Sherman Sharon L
Bought by
Hullinghorst Jodi
Home Financials for this Owner
Home Financials are based on the most recent Mortgage that was taken out on this home.
Original Mortgage
$40,000
Interest Rate
7.18%
Mortgage Type
Purchase Money Mortgage
Create a Home Valuation Report for This Property
The Home Valuation Report is an in-depth analysis detailing your home's value as well as a comparison with similar homes in the area
Home Values in the Area
Average Home Value in this Area
Purchase History
| Date | Buyer | Sale Price | Title Company |
|---|---|---|---|
| Hallford Christopher | $68,100 | -- | |
| Hallford Christopher | $68,100 | -- | |
| Bradshaw Andrew | $38,000 | -- | |
| Bradshaw Andrew | $38,000 | -- | |
| Fhlmc | $60,200 | -- | |
| Fhlmc | $60,200 | -- | |
| Hullinghorst Jodi | $50,000 | -- | |
| Hullinghorst Jodi | $50,000 | -- |
Source: Public Records
Mortgage History
| Date | Status | Borrower | Loan Amount |
|---|---|---|---|
| Previous Owner | Hullinghorst Jodi | $40,000 | |
| Closed | Hullinghorst Jodi | $0 |
Source: Public Records
Tax History Compared to Growth
Tax History
| Year | Tax Paid | Tax Assessment Tax Assessment Total Assessment is a certain percentage of the fair market value that is determined by local assessors to be the total taxable value of land and additions on the property. | Land | Improvement |
|---|---|---|---|---|
| 2024 | $2,495 | $130,900 | $63,800 | $67,100 |
| 2023 | $2,246 | $83,600 | $38,600 | $45,000 |
| 2022 | $2,075 | $83,000 | $38,000 | $45,000 |
| 2021 | $2,034 | $83,000 | $38,000 | $45,000 |
| 2020 | $2,131 | $83,000 | $38,000 | $45,000 |
| 2019 | $2,138 | $83,000 | $38,000 | $45,000 |
| 2018 | $1,900 | $64,000 | $19,200 | $44,800 |
| 2017 | $1,802 | $64,000 | $19,200 | $44,800 |
| 2016 | $1,810 | $62,700 | $19,200 | $43,500 |
| 2015 | $1,667 | $62,700 | $19,200 | $43,500 |
| 2014 | $1,650 | $62,700 | $19,200 | $43,500 |
| 2011 | $1,737 | $68,700 | $25,900 | $42,800 |
Source: Public Records
Map
Nearby Homes
- 19 Aylward Ave
- 59 S Winchester St
- 1 Cherry Tree Ln
- 3 N Winchester St
- 626 W Swanzey Rd
- 121 Pondview Rd
- 68 Brookview Rd
- 20 Anthony Cir Unit 20
- 332 Eaton Rd
- 28 Owens Dr Unit 92
- 28 Owens Dr Unit 94
- 90 Old Swanzey Rd
- 24 Sawyers Crossing Rd
- 188 Sawyers Crossing Rd
- 0 Winch Hill Rd Unit 5022598
- 19 Day Rd
- 196 Whitcomb Rd
- 238 Base Hill Rd Unit A12
- 25 Schult St
- 23 Schult St
- 7 Aylward Ave
- 13 Aylward Ave
- 10 Aylward Ave
- 6 Aylward Ave
- 3 Aylward Ave
- 50 West St
- 18 Aylward Ave
- 54 West St
- 66 West St
- 52 West St
- 22 Aylward Ave
- 53 West St
- 705 W Swanzey Rd
- 0 W Street & Rte 10 Unit 4862239
- 0 W Street & Rte 10
- 0 W St & Rte 10
- 27 Aylward Ave
- 71 West St
- 704 W Swanzey Rd
- 0 Route 10 Unit 4843652