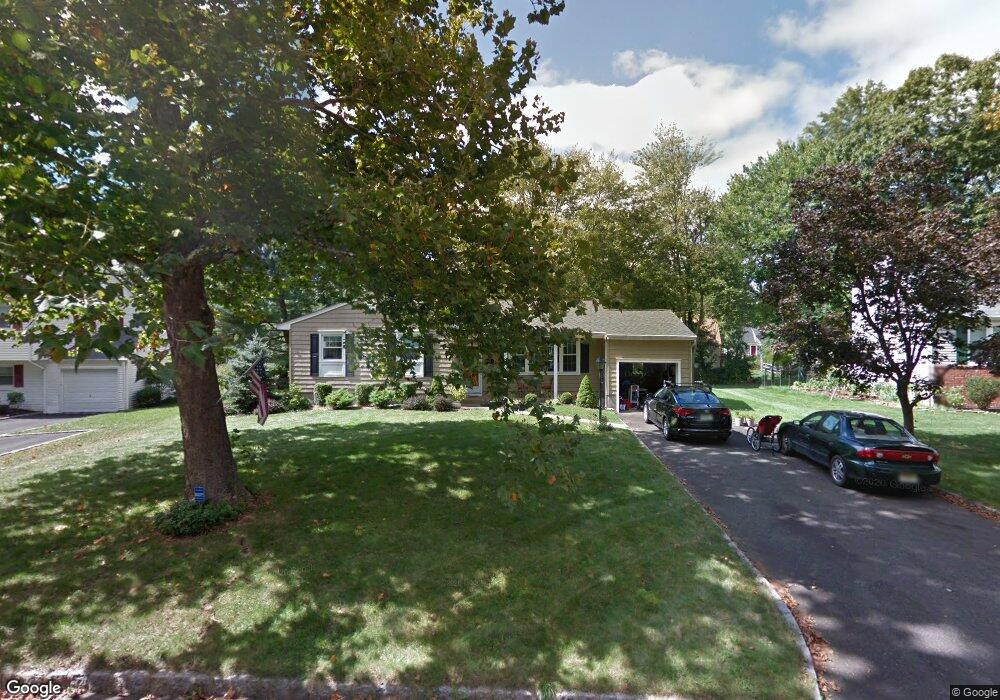
11 Badgley Dr New Providence, NJ 07974
Estimated Value: $757,000 - $819,001
--
Bed
--
Bath
1,227
Sq Ft
$637/Sq Ft
Est. Value
About This Home
This home is located at 11 Badgley Dr, New Providence, NJ 07974 and is currently estimated at $781,750, approximately $637 per square foot. 11 Badgley Dr is a home located in Union County with nearby schools including New Providence High School, The Academy of Our Lady of Peace, and Oak Knoll School of the Holy Child.
Ownership History
Date
Name
Owned For
Owner Type
Purchase Details
Closed on
Feb 23, 2012
Sold by
Manzione Matthew and Manzione Jenifer
Bought by
Manzione Matthew and Manzione Jenifer
Current Estimated Value
Home Financials for this Owner
Home Financials are based on the most recent Mortgage that was taken out on this home.
Original Mortgage
$437,789
Outstanding Balance
$307,162
Interest Rate
4.4%
Mortgage Type
FHA
Estimated Equity
$474,588
Purchase Details
Closed on
Jun 17, 2009
Sold by
Skillen Robert M and Skillen John M
Bought by
Manzione Matthew and Messinger Jenifer
Home Financials for this Owner
Home Financials are based on the most recent Mortgage that was taken out on this home.
Original Mortgage
$449,200
Interest Rate
4.86%
Mortgage Type
FHA
Create a Home Valuation Report for This Property
The Home Valuation Report is an in-depth analysis detailing your home's value as well as a comparison with similar homes in the area
Home Values in the Area
Average Home Value in this Area
Purchase History
| Date | Buyer | Sale Price | Title Company |
|---|---|---|---|
| Manzione Matthew | -- | Greater Nj Title Agency Inc | |
| Manzione Matthew | $481,500 | None Available |
Source: Public Records
Mortgage History
| Date | Status | Borrower | Loan Amount |
|---|---|---|---|
| Open | Manzione Matthew | $437,789 | |
| Closed | Manzione Matthew | $449,200 |
Source: Public Records
Tax History Compared to Growth
Tax History
| Year | Tax Paid | Tax Assessment Tax Assessment Total Assessment is a certain percentage of the fair market value that is determined by local assessors to be the total taxable value of land and additions on the property. | Land | Improvement |
|---|---|---|---|---|
| 2025 | $13,272 | $257,100 | $140,800 | $116,300 |
| 2024 | $12,873 | $257,100 | $140,800 | $116,300 |
| 2023 | $12,873 | $257,100 | $140,800 | $116,300 |
| 2022 | $12,696 | $257,100 | $140,800 | $116,300 |
| 2021 | $12,603 | $257,100 | $140,800 | $116,300 |
| 2020 | $12,598 | $257,100 | $140,800 | $116,300 |
| 2019 | $12,521 | $257,100 | $140,800 | $116,300 |
| 2018 | $11,851 | $244,600 | $140,800 | $103,800 |
| 2017 | $11,658 | $244,600 | $140,800 | $103,800 |
| 2016 | $11,494 | $244,600 | $140,800 | $103,800 |
| 2015 | $11,335 | $244,600 | $140,800 | $103,800 |
| 2014 | $11,164 | $244,600 | $140,800 | $103,800 |
Source: Public Records
Map
Nearby Homes
- 54 Badgley Dr
- 34 Grant Ave
- 1200 Springfield Ave Unit 1B
- 72 Central Ave
- 106 Stoneridge Rd
- 32 Marion Ave
- 45 the Fellsway
- 16 Riverbend Ct
- 197 Elkwood Ave
- 19 Division Ave
- 52 Greenwood Rd
- 340 Livingston Ave
- 282 South St
- 20 High St
- 29 Walton Ave
- 100 Commonwealth Ave
- 32 Charnwood Rd
- 17 Valley View Ave
- 14 Holmes Oval
- 283 Riveredge Dr