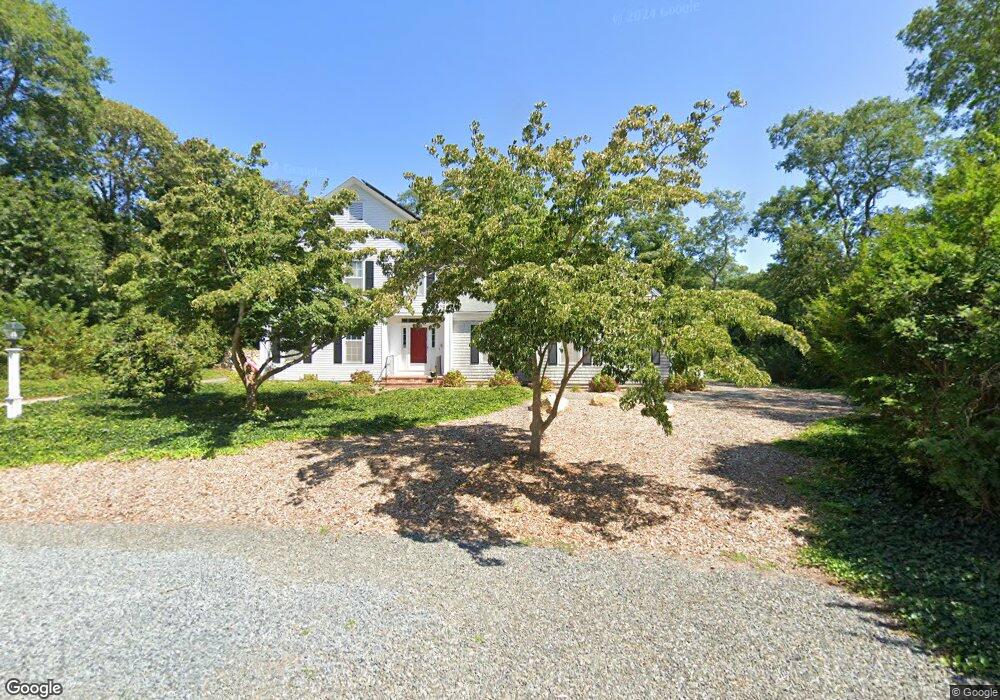
11 Bambi Way Orleans, MA 02653
Estimated Value: $1,978,000 - $2,459,000
6
Beds
4
Baths
3,944
Sq Ft
$534/Sq Ft
Est. Value
About This Home
This home is located at 11 Bambi Way, Orleans, MA 02653 and is currently estimated at $2,106,960, approximately $534 per square foot. 11 Bambi Way is a home located in Barnstable County with nearby schools including Orleans Elementary School, Nauset Regional Middle School, and Nauset Regional High School.
Ownership History
Date
Name
Owned For
Owner Type
Purchase Details
Closed on
Oct 19, 2021
Sold by
Mccabe Pamela B
Bought by
Mccabe Pamela B and Mccabe John R
Current Estimated Value
Purchase Details
Closed on
Jul 7, 2021
Sold by
Burlingame John M
Bought by
Mccabe Pamela B
Purchase Details
Closed on
Nov 10, 2015
Sold by
Burlingame John M
Bought by
Burlingame John M
Purchase Details
Closed on
Jul 14, 2015
Sold by
Burlingame 3Rd John H
Bought by
Burlingame 3Rd John H
Purchase Details
Closed on
Jul 2, 2015
Sold by
John H Burlingame 3Rd
Bought by
Burlingame 3Rd John H
Create a Home Valuation Report for This Property
The Home Valuation Report is an in-depth analysis detailing your home's value as well as a comparison with similar homes in the area
Home Values in the Area
Average Home Value in this Area
Purchase History
| Date | Buyer | Sale Price | Title Company |
|---|---|---|---|
| Mccabe Pamela B | -- | None Available | |
| Mccabe Pamela B | -- | None Available | |
| Burlingame John M | -- | -- | |
| Burlingame 3Rd John H | -- | -- | |
| Burlingame 3Rd John H | -- | -- |
Source: Public Records
Tax History Compared to Growth
Tax History
| Year | Tax Paid | Tax Assessment Tax Assessment Total Assessment is a certain percentage of the fair market value that is determined by local assessors to be the total taxable value of land and additions on the property. | Land | Improvement |
|---|---|---|---|---|
| 2025 | $12,525 | $2,007,200 | $279,900 | $1,727,300 |
| 2024 | $11,155 | $1,740,300 | $274,400 | $1,465,900 |
| 2023 | $9,826 | $1,577,200 | $254,100 | $1,323,100 |
| 2022 | $8,812 | $1,223,900 | $231,000 | $992,900 |
| 2021 | $8,289 | $1,057,300 | $229,500 | $827,800 |
| 2020 | $7,752 | $1,025,400 | $229,500 | $795,900 |
| 2019 | $7,424 | $1,003,300 | $223,100 | $780,200 |
| 2018 | $6,490 | $978,900 | $218,800 | $760,100 |
| 2017 | $5,711 | $902,200 | $218,800 | $683,400 |
| 2016 | $5,782 | $895,100 | $217,000 | $678,100 |
| 2015 | $5,493 | $855,600 | $212,800 | $642,800 |
Source: Public Records
Map
Nearby Homes
- 42 Towhee Ln
- 645 S Orleans Rd
- 532 S Orleans Rd
- 77 Towhee Ln
- 204 Timberlane Dr
- 0 Pine Grove Rd Unit 22503517
- 0 Pine Grove Rd Unit 73397945
- 171 Timberlane Dr
- 34 Lake Dr
- 33 Rogers Rd
- 17 Crescent Ridge Way
- 30 Grannys Ln
- 0 S Orleans Rd
- 5 Blackberry Ln
- 193 Quanset Rd
- 34 Uncle Israel Rd
- 2 Monomoy Ln
- 8 Monomoy Ln
- 4 Monomoy Ln