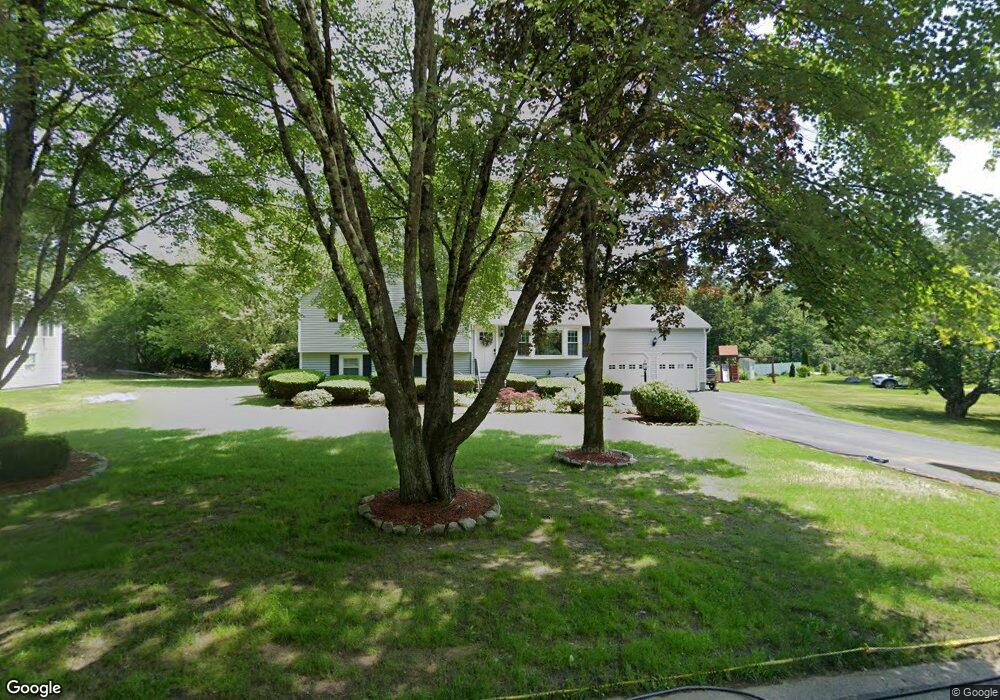
11 Berkley St MerriMacK, NH 03054
Estimated Value: $531,907 - $574,000
3
Beds
1
Bath
1,942
Sq Ft
$284/Sq Ft
Est. Value
About This Home
This home is located at 11 Berkley St, MerriMacK, NH 03054 and is currently estimated at $551,227, approximately $283 per square foot. 11 Berkley St is a home located in Hillsborough County with nearby schools including Reeds Ferry School, James Mastricola Upper Elementary School, and Merrimack Middle School.
Ownership History
Date
Name
Owned For
Owner Type
Purchase Details
Closed on
May 28, 2010
Sold by
Cunningham Hwa Y
Bought by
Ditullio Gregory
Current Estimated Value
Home Financials for this Owner
Home Financials are based on the most recent Mortgage that was taken out on this home.
Original Mortgage
$197,342
Interest Rate
5.13%
Mortgage Type
Purchase Money Mortgage
Purchase Details
Closed on
Nov 5, 2002
Sold by
Mckelvey John D and Mckelvey Kathleen
Bought by
Cunningham Hwa Y
Create a Home Valuation Report for This Property
The Home Valuation Report is an in-depth analysis detailing your home's value as well as a comparison with similar homes in the area
Home Values in the Area
Average Home Value in this Area
Purchase History
| Date | Buyer | Sale Price | Title Company |
|---|---|---|---|
| Ditullio Gregory | $205,000 | -- | |
| Cunningham Hwa Y | $238,500 | -- |
Source: Public Records
Mortgage History
| Date | Status | Borrower | Loan Amount |
|---|---|---|---|
| Open | Cunningham Hwa Y | $182,400 | |
| Closed | Cunningham Hwa Y | $197,342 | |
| Previous Owner | Cunningham Hwa Y | $261,600 |
Source: Public Records
Tax History Compared to Growth
Tax History
| Year | Tax Paid | Tax Assessment Tax Assessment Total Assessment is a certain percentage of the fair market value that is determined by local assessors to be the total taxable value of land and additions on the property. | Land | Improvement |
|---|---|---|---|---|
| 2024 | $7,707 | $372,500 | $203,000 | $169,500 |
| 2023 | $7,245 | $372,500 | $203,000 | $169,500 |
| 2022 | $6,474 | $372,500 | $203,000 | $169,500 |
| 2021 | $6,396 | $372,500 | $203,000 | $169,500 |
| 2020 | $6,361 | $264,400 | $139,200 | $125,200 |
| 2019 | $6,380 | $264,400 | $139,200 | $125,200 |
| 2018 | $6,377 | $264,400 | $139,200 | $125,200 |
| 2017 | $6,179 | $264,400 | $139,200 | $125,200 |
| 2016 | $6,026 | $264,400 | $139,200 | $125,200 |
| 2015 | $5,962 | $241,200 | $126,300 | $114,900 |
| 2014 | $5,811 | $241,200 | $126,300 | $114,900 |
| 2013 | $5,767 | $241,200 | $126,300 | $114,900 |
Source: Public Records
Map
Nearby Homes
- 22 Clay St
- 98 Indian Rock Rd
- 38 Mallard Point
- 8 Donovan Ct
- 3 Independence Dr
- 5 Fernwood Dr
- 19 Vista Way
- 10 Kingston Ct Unit 10
- 22 Essex Green Ct
- 12 Clinton Ct
- 11 Essex Green Ct
- 8 Highland Green Ln
- 7 Hadley Rd
- 1 Pleasant St
- 5 Barbie Ct
- 7 Beacon Dr
- 29 Bedford Rd
- 14 Mayflower Dr
- 20 Jakes Ln
- 40 Turkey Hill Rd