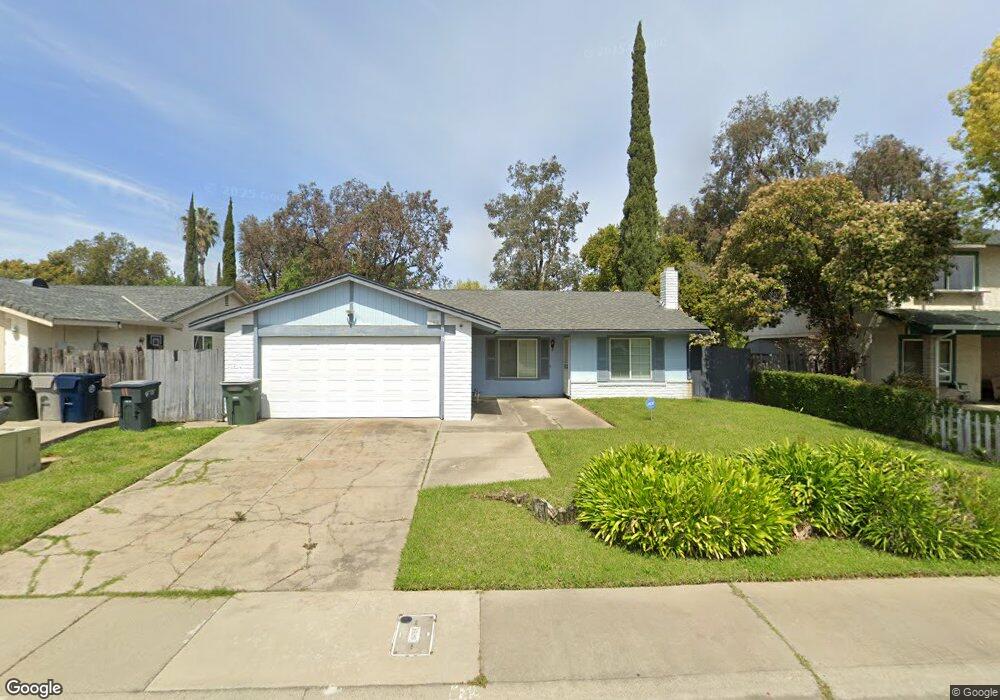
11 Bethany Ct Sacramento, CA 95823
North Laguna NeighborhoodEstimated Value: $381,000 - $469,000
3
Beds
2
Baths
1,327
Sq Ft
$321/Sq Ft
Est. Value
About This Home
This home is located at 11 Bethany Ct, Sacramento, CA 95823 and is currently estimated at $426,598, approximately $321 per square foot. 11 Bethany Ct is a home located in Sacramento County with nearby schools including Herman Leimbach Elementary School, Samuel Jackman Middle School, and Valley High School.
Ownership History
Date
Name
Owned For
Owner Type
Purchase Details
Closed on
Jan 26, 2005
Sold by
Lyles Michael
Bought by
Lyles Hettie
Current Estimated Value
Home Financials for this Owner
Home Financials are based on the most recent Mortgage that was taken out on this home.
Original Mortgage
$247,200
Outstanding Balance
$130,979
Interest Rate
6.4%
Mortgage Type
Purchase Money Mortgage
Estimated Equity
$295,619
Purchase Details
Closed on
Feb 25, 2004
Sold by
Glover Cynthia
Bought by
Lyles Michael
Home Financials for this Owner
Home Financials are based on the most recent Mortgage that was taken out on this home.
Original Mortgage
$191,200
Interest Rate
8.25%
Mortgage Type
Purchase Money Mortgage
Purchase Details
Closed on
Jun 18, 1998
Sold by
Diversified Unlimited Inc
Bought by
Glover Cynthia
Purchase Details
Closed on
May 8, 1998
Sold by
Edwards Terry B
Bought by
Diversified Unlimited Inc
Purchase Details
Closed on
Jan 9, 1997
Sold by
Edwards Colleen
Bought by
Edwards Terry B
Create a Home Valuation Report for This Property
The Home Valuation Report is an in-depth analysis detailing your home's value as well as a comparison with similar homes in the area
Home Values in the Area
Average Home Value in this Area
Purchase History
| Date | Buyer | Sale Price | Title Company |
|---|---|---|---|
| Lyles Hettie | $309,000 | Financial Title Company | |
| Lyles Michael | $239,000 | Financial Title Company | |
| Glover Cynthia | -- | -- | |
| Diversified Unlimited Inc | $85,500 | -- | |
| Edwards Terry B | -- | -- |
Source: Public Records
Mortgage History
| Date | Status | Borrower | Loan Amount |
|---|---|---|---|
| Open | Lyles Hettie | $247,200 | |
| Closed | Lyles Michael | $191,200 | |
| Closed | Lyles Michael | $23,900 | |
| Closed | Lyles Hettie | $61,800 |
Source: Public Records
Tax History
| Year | Tax Paid | Tax Assessment Tax Assessment Total Assessment is a certain percentage of the fair market value that is determined by local assessors to be the total taxable value of land and additions on the property. | Land | Improvement |
|---|---|---|---|---|
| 2025 | $3,762 | $339,786 | $106,623 | $233,163 |
| 2024 | $3,762 | $333,125 | $104,533 | $228,592 |
| 2023 | $3,657 | $326,594 | $102,484 | $224,110 |
| 2022 | $3,605 | $320,191 | $100,475 | $219,716 |
| 2021 | $3,554 | $313,913 | $98,505 | $215,408 |
| 2020 | $3,177 | $280,139 | $87,907 | $192,232 |
| 2019 | $2,982 | $261,814 | $82,157 | $179,657 |
| 2018 | $2,848 | $251,746 | $78,998 | $172,748 |
| 2017 | $2,670 | $235,277 | $73,830 | $161,447 |
| 2016 | $2,441 | $217,850 | $68,362 | $149,488 |
| 2015 | $2,221 | $198,047 | $62,148 | $135,899 |
| 2014 | $2,119 | $186,837 | $58,630 | $128,207 |
Source: Public Records
Map
Nearby Homes
- 0 Rangeview Ln
- 7952 Grandstaff Dr
- 7948 Grandstaff Dr
- 9 Graywood Ct
- 7711 Lenhart Rd
- 61 Brentford Cir
- 8095 E Stockton Blvd
- 7117 Snowy Birch Way
- 7950 Roseview Way
- 7901 Stevenson Ave
- 6119 Bamford Dr
- 8015 Center Pkwy
- 4.13 ACR Lenhart Rd
- 5953 Bamford Dr
- 8016 Stevenson Ave
- 7402 Kallie Kay Ln
- 7523 Sunfaire Ln
- 8237 Center Pkwy
- 5935 Bamford Dr
- 5919 Bamford Dr
- 15 Bethany Ct
- 7 Bethany Ct
- 19 Bethany Ct
- 7980 Arroyo Vista Dr
- 14 Bethany Ct
- 7984 Arroyo Vista Dr
- 10 Bethany Ct
- 18 Bethany Ct
- 6 Bethany Ct
- 22 Bethany Ct
- 7992 Arroyo Vista Dr
- 23 Abbeywood Cir
- 19 Abbeywood Cir
- 27 Abbeywood Cir
- 15 Abbeywood Cir
- 7996 Arroyo Vista Dr
- 7981 Arroyo Vista Dr
- 31 Abbeywood Cir
- 7985 Arroyo Vista Dr
- 9 Abbeywood Cir
Your Personal Tour Guide
Ask me questions while you tour the home.