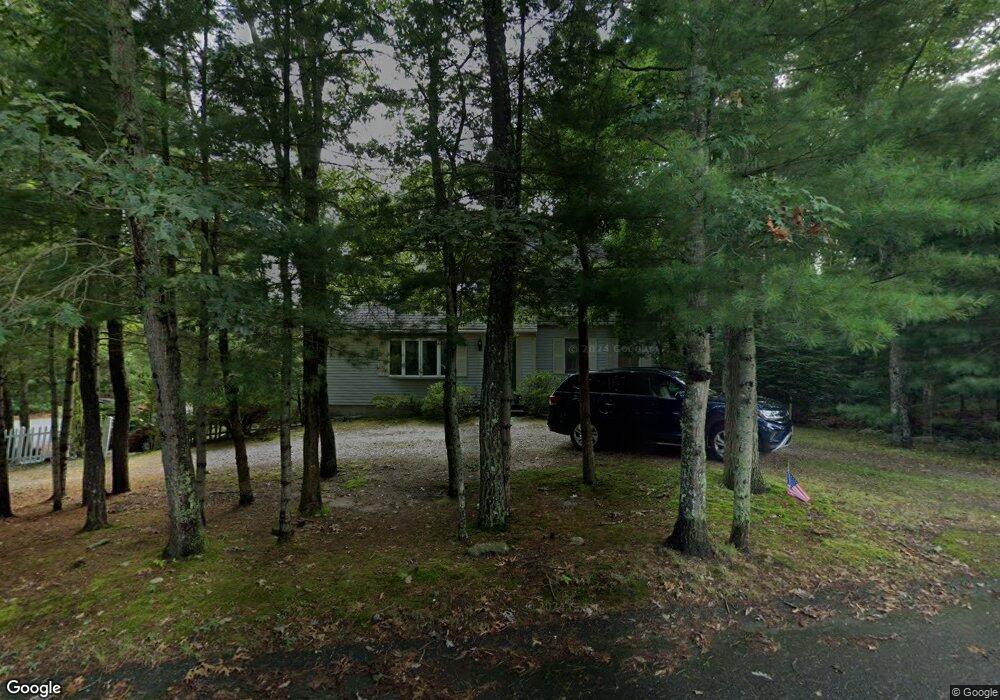
11 Binnacle Rd East Falmouth, MA 02536
Hatchville NeighborhoodEstimated Value: $706,000 - $945,000
4
Beds
3
Baths
2,130
Sq Ft
$368/Sq Ft
Est. Value
About This Home
This home is located at 11 Binnacle Rd, East Falmouth, MA 02536 and is currently estimated at $783,685, approximately $367 per square foot. 11 Binnacle Rd is a home located in Barnstable County with nearby schools including Mullen-Hall School, Morse Pond School, and Lawrence School.
Ownership History
Date
Name
Owned For
Owner Type
Purchase Details
Closed on
Sep 23, 1997
Sold by
Jmb Rt and Bolton
Bought by
Zoshak William
Current Estimated Value
Purchase Details
Closed on
Aug 6, 1996
Sold by
Hogan Shirley A and Hogan Richard
Bought by
Jmb Rt and Bolton
Home Financials for this Owner
Home Financials are based on the most recent Mortgage that was taken out on this home.
Original Mortgage
$95,000
Interest Rate
8.27%
Mortgage Type
Purchase Money Mortgage
Create a Home Valuation Report for This Property
The Home Valuation Report is an in-depth analysis detailing your home's value as well as a comparison with similar homes in the area
Home Values in the Area
Average Home Value in this Area
Purchase History
| Date | Buyer | Sale Price | Title Company |
|---|---|---|---|
| Zoshak William | $163,814 | -- | |
| Zoshak William | $163,814 | -- | |
| Jmb Rt | $29,000 | -- | |
| Jmb Rt | $29,000 | -- |
Source: Public Records
Mortgage History
| Date | Status | Borrower | Loan Amount |
|---|---|---|---|
| Previous Owner | Jmb Rt | $95,000 |
Source: Public Records
Tax History Compared to Growth
Tax History
| Year | Tax Paid | Tax Assessment Tax Assessment Total Assessment is a certain percentage of the fair market value that is determined by local assessors to be the total taxable value of land and additions on the property. | Land | Improvement |
|---|---|---|---|---|
| 2025 | $3,622 | $617,000 | $140,600 | $476,400 |
| 2024 | $3,554 | $566,000 | $133,200 | $432,800 |
| 2023 | $3,517 | $508,300 | $133,200 | $375,100 |
| 2022 | $3,032 | $376,600 | $100,400 | $276,200 |
| 2021 | $2,897 | $340,800 | $96,100 | $244,700 |
| 2020 | $2,852 | $332,000 | $87,300 | $244,700 |
| 2019 | $2,794 | $326,400 | $87,300 | $239,100 |
| 2018 | $2,715 | $315,700 | $87,300 | $228,400 |
| 2017 | $2,614 | $306,400 | $87,300 | $219,100 |
| 2016 | $2,565 | $306,400 | $87,300 | $219,100 |
| 2015 | $2,509 | $306,400 | $87,300 | $219,100 |
| 2014 | $2,524 | $309,700 | $91,900 | $217,800 |
Source: Public Records
Map
Nearby Homes
- 59 Whitecaps Dr
- 12 Rock Hollow Dr
- 73 Lake Shore Dr
- 0 Lake Shore Dr
- 0 Lake Shore Dr Unit 22402823
- 68 Deepwood Dr
- 590 Sandwich Rd
- 17 Pinewood Dr
- 25 Harris Hill Rd
- 33 Chilmark Dr Unit 33
- 34 Marla Ln
- 793 Blacksmith Shop Rd
- 11 Shallow Pond Ln
- 63 Tanglewood Dr
- 100 Tanglewood Dr
- 18 Tree Top Ln
- 66 Braxton Rd
- 32 Jamie Ln
- 0 Whitecaps Dr
- 7 Binnacle Rd
- 53 Whitecaps Dr
- 47 Binnacle Rd
- 10 Binnacle Rd
- 14 Binnacle Rd
- 6 Binnacle Rd
- 3 Binnacle Rd
- 3 Binnacle Rd
- 50 Whitecaps Dr
- 46 Whitecaps Dr
- 258 Pinecrest Beach Dr
- 37 Whitecaps Dr
- 56 Whitecaps Dr
- 2 Binnacle Rd
- 42 Whitecaps Dr
- 60 Whitecaps Dr
- 63 Whitecaps Dr
- 29 Whitecaps Dr
- 264 Pinecrest Beach Dr