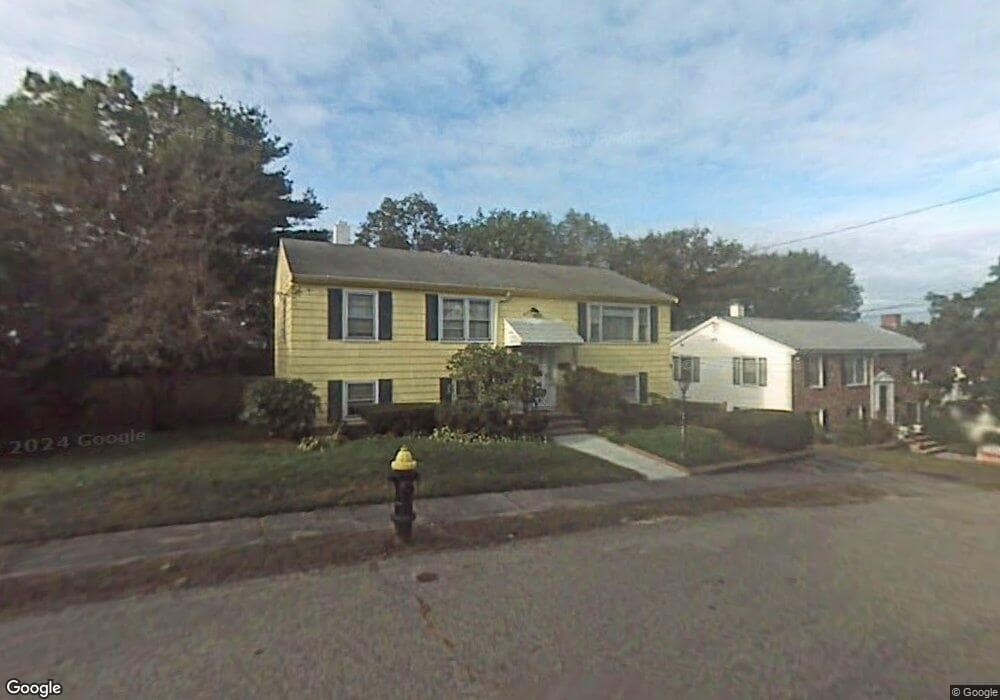
11 Blueview Cir West Roxbury, MA 02132
Upper Washington-Spring Street NeighborhoodEstimated Value: $752,000 - $847,000
3
Beds
2
Baths
1,688
Sq Ft
$471/Sq Ft
Est. Value
About This Home
This home is located at 11 Blueview Cir, West Roxbury, MA 02132 and is currently estimated at $795,400, approximately $471 per square foot. 11 Blueview Cir is a home located in Suffolk County with nearby schools including St Theresa School and The Roxbury Latin School.
Ownership History
Date
Name
Owned For
Owner Type
Purchase Details
Closed on
Aug 11, 2009
Sold by
Goode Maria C and Egershiem Leonora C
Bought by
Torres Godofredo D and Torres Delustancia V
Current Estimated Value
Home Financials for this Owner
Home Financials are based on the most recent Mortgage that was taken out on this home.
Original Mortgage
$355,443
Outstanding Balance
$234,805
Interest Rate
5.47%
Mortgage Type
Purchase Money Mortgage
Estimated Equity
$560,595
Create a Home Valuation Report for This Property
The Home Valuation Report is an in-depth analysis detailing your home's value as well as a comparison with similar homes in the area
Home Values in the Area
Average Home Value in this Area
Purchase History
| Date | Buyer | Sale Price | Title Company |
|---|---|---|---|
| Torres Godofredo D | $362,000 | -- |
Source: Public Records
Mortgage History
| Date | Status | Borrower | Loan Amount |
|---|---|---|---|
| Open | Torres Godofredo D | $355,443 |
Source: Public Records
Tax History Compared to Growth
Tax History
| Year | Tax Paid | Tax Assessment Tax Assessment Total Assessment is a certain percentage of the fair market value that is determined by local assessors to be the total taxable value of land and additions on the property. | Land | Improvement |
|---|---|---|---|---|
| 2025 | $7,220 | $623,500 | $279,000 | $344,500 |
| 2024 | $6,833 | $626,900 | $287,600 | $339,300 |
| 2023 | $6,414 | $597,200 | $274,000 | $323,200 |
| 2022 | $6,016 | $552,900 | $253,700 | $299,200 |
| 2021 | $5,448 | $510,600 | $239,300 | $271,300 |
| 2020 | $4,992 | $472,700 | $222,300 | $250,400 |
| 2019 | $4,413 | $418,700 | $168,700 | $250,000 |
| 2018 | $4,177 | $398,600 | $168,700 | $229,900 |
| 2017 | $4,138 | $390,700 | $168,700 | $222,000 |
| 2016 | $4,172 | $379,300 | $168,700 | $210,600 |
| 2015 | $4,392 | $362,700 | $150,600 | $212,100 |
| 2014 | $4,261 | $338,700 | $150,600 | $188,100 |
Source: Public Records
Map
Nearby Homes
- 45 Weymouth Ave
- 11 Cheriton Rd Unit 102B
- 4975 Washington St Unit 311
- 4959 Washington St
- 150 Grove St
- 10 Starling St
- 14 Starling St
- 15 Starling St
- 70 Birchwood St
- 5245 Washington St Unit 5
- 35 Heron St
- 50 Heron St
- 4873 Washington St Unit 1
- 115 Grove St Unit 11
- 111 Grove St Unit 6
- 94 Rockland St
- 12 Eagle St
- 57 Rockland St
- 25R Rockland St Unit 6
- 42 Raldne Rd Unit 1
- 7 Blueview Cir
- 15 Blueview Cir
- 10 Cedarcrest Rd
- 3 Blueview Cir
- 6 Cedarcrest Rd
- 10 Blueview Cir
- 6 Blueview Cir
- 19 Blueview Cir
- 5 Blueview Rd
- 2 Blueview Cir
- 82 Woodley Ave
- 14 Blueview Cir
- 18 Blueview Cir
- 78 Woodley Ave
- 9 Blueview Rd
- 9 Cedarcrest Rd
- 15 Cedarcrest Rd
- 74 Woodley Ave
- 14 Cedarcrest Terrace
- 11 Blueview Rd