11 Bobolink Ln Greenwich, CT 06830
Mid-Country East NeighborhoodEstimated payment $33,655/month
Highlights
- Private Pool
- Sauna
- 3 Fireplaces
- North Street School Rated A+
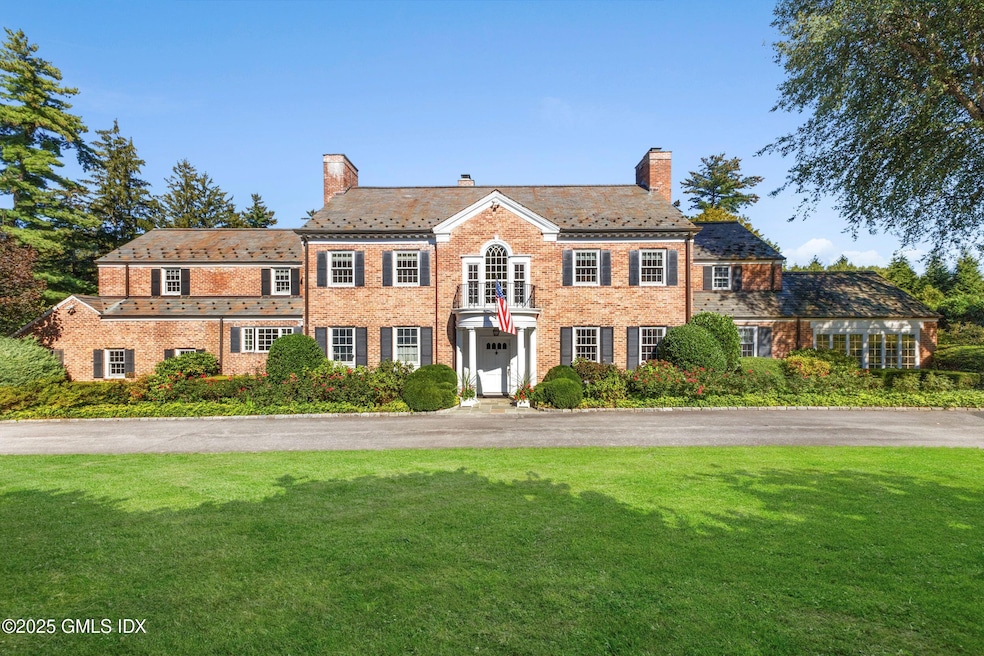
- Colonial Architecture
- Solarium
About This Home
1st time on market in 50 years! Lovingly maintained Stately brick and slate Georgian colonial built in 1941. Elegant 5,500 +/- sf 5 bedroom, 6+ bath, center hall classic built of the finest materials and craftsmanship encompassing both light-filled formal and informal rooms. English entrance hall with sweeping staircase, generous living room with fireplace, handsome pine paneled library, eat-in kitchen, solarium, office, family/game room and spa. Spacious primary suite with walk-in closets and luxury bath, 4 additional bedrooms and rear staircase. Nestled on 1.79 parklike acres enhanced by mature grounds, walled gardens, expansive patio, pool, tennis court and 3-car garage. Ideally situated on a peaceful lane in one of Greenwich's most coveted locations with close proximity to town.
Home Details
Home Type
- Single Family
Est. Annual Taxes
- $31,440
Year Built
- Built in 1941 | Remodeled in 2015
Lot Details
- 1.79 Acre Lot
- Property is zoned RA-2
Parking
- 3 Car Attached Garage
Home Design
- Colonial Architecture
- Brick Exterior Construction
- Slate Roof
Interior Spaces
- 5,441 Sq Ft Home
- Rear Stairs
- Paneling
- 3 Fireplaces
- Entrance Foyer
- Formal Dining Room
- Home Office
- Solarium
- Sauna
- Eat-In Kitchen
- Walkup Attic
- Home Security System
- Unfinished Basement
Bedrooms and Bathrooms
- 5 Bedrooms
- Walk-In Closet
Pool
- Private Pool
- Spa
- Outdoor Shower
Utilities
- Forced Air Heating and Cooling System
- Heating System Uses Gas
- Heating System Uses Natural Gas
- Power Generator
- Gas Available
- Gas Water Heater
Listing and Financial Details
- Assessor Parcel Number 11-1211/S
Map
Home Values in the Area
Average Home Value in this Area
Tax History
| Year | Tax Paid | Tax Assessment Tax Assessment Total Assessment is a certain percentage of the fair market value that is determined by local assessors to be the total taxable value of land and additions on the property. | Land | Improvement |
|---|---|---|---|---|
| 2021 | $29,335 | $2,651,390 | $1,005,900 | $1,645,490 |
Property History
| Date | Event | Price | List to Sale | Price per Sq Ft |
|---|---|---|---|---|
| 09/29/2025 09/29/25 | Pending | -- | -- | -- |
| 09/23/2025 09/23/25 | For Sale | $5,900,000 | -- | $1,084 / Sq Ft |
Source: Greenwich Association of REALTORS®
MLS Number: 123635
APN: GREE M:11 B:1211/S
Disclaimer: Certain information contained herein is derived from information provided by parties other than Homes.com. All information provided is deemed reliable, but is not guaranteed to be accurate and should be independently verified.
![]() Listing data courtesy of Greenwich MLS. IDX information is provided exclusively for consumers’ personal, non-commercial use, that it may not be used for any purpose other than to
Listing data courtesy of Greenwich MLS. IDX information is provided exclusively for consumers’ personal, non-commercial use, that it may not be used for any purpose other than to
identify prospective properties consumers may be interested in purchasing. Data is deemed reliable but is not guaranteed accurate by the MLS.
