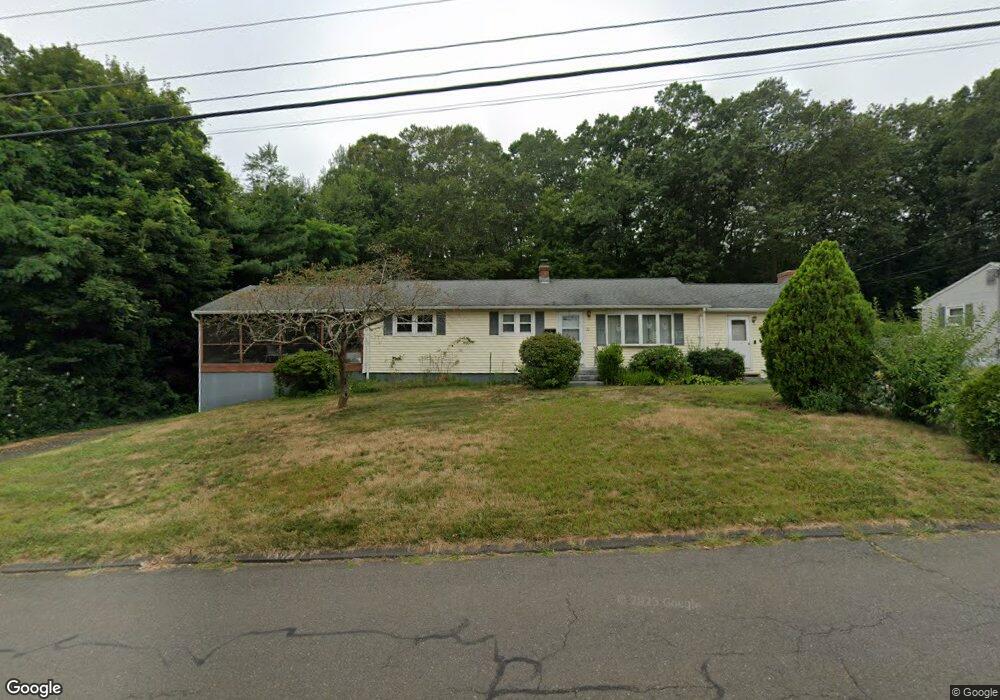
11 Booth St Enfield, CT 06082
Estimated Value: $308,000 - $338,309
3
Beds
1
Bath
1,360
Sq Ft
$239/Sq Ft
Est. Value
About This Home
This home is located at 11 Booth St, Enfield, CT 06082 and is currently estimated at $324,577, approximately $238 per square foot. 11 Booth St is a home located in Hartford County with nearby schools including Prudence Crandall Elementary School, Henry Barnard Elementary School, and Enfield High School.
Ownership History
Date
Name
Owned For
Owner Type
Purchase Details
Closed on
Dec 16, 1998
Sold by
Dube William and Dube Shirley
Bought by
Cicoria Tracy and Cicoria Michael
Current Estimated Value
Home Financials for this Owner
Home Financials are based on the most recent Mortgage that was taken out on this home.
Original Mortgage
$122,500
Interest Rate
6.85%
Create a Home Valuation Report for This Property
The Home Valuation Report is an in-depth analysis detailing your home's value as well as a comparison with similar homes in the area
Home Values in the Area
Average Home Value in this Area
Purchase History
| Date | Buyer | Sale Price | Title Company |
|---|---|---|---|
| Cicoria Tracy | $124,000 | -- |
Source: Public Records
Mortgage History
| Date | Status | Borrower | Loan Amount |
|---|---|---|---|
| Open | Cicoria Tracy | $113,700 | |
| Closed | Cicoria Tracy | $122,500 | |
| Previous Owner | Cicoria Tracy | $70,000 |
Source: Public Records
Tax History
| Year | Tax Paid | Tax Assessment Tax Assessment Total Assessment is a certain percentage of the fair market value that is determined by local assessors to be the total taxable value of land and additions on the property. | Land | Improvement |
|---|---|---|---|---|
| 2025 | $5,599 | $161,600 | $54,400 | $107,200 |
| 2024 | $5,464 | $161,600 | $54,400 | $107,200 |
| 2023 | $5,375 | $161,600 | $54,400 | $107,200 |
| 2022 | $4,943 | $161,600 | $54,400 | $107,200 |
| 2021 | $4,958 | $132,650 | $42,940 | $89,710 |
| 2020 | $4,958 | $132,650 | $42,940 | $89,710 |
| 2019 | $4,958 | $132,650 | $42,940 | $89,710 |
| 2018 | $4,848 | $132,650 | $42,940 | $89,710 |
| 2017 | $4,587 | $132,650 | $42,940 | $89,710 |
| 2016 | $4,617 | $135,760 | $48,090 | $87,670 |
| 2015 | $4,486 | $135,760 | $48,090 | $87,670 |
| 2014 | $4,382 | $135,760 | $48,090 | $87,670 |
Source: Public Records
Map
Nearby Homes
Your Personal Tour Guide
Ask me questions while you tour the home.