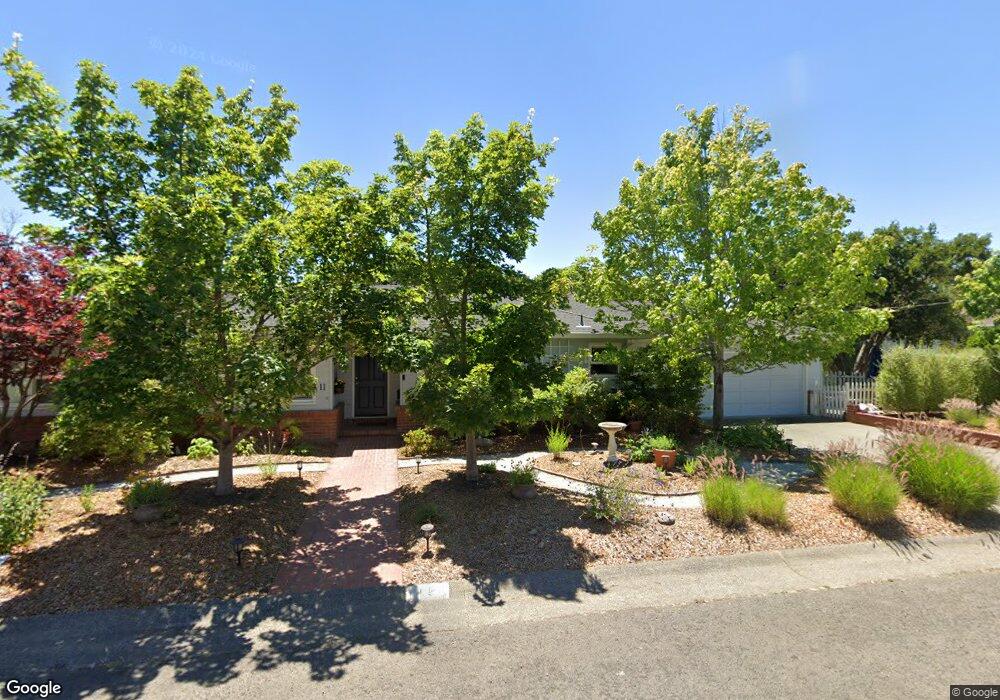
11 Brainerd Ave Petaluma, CA 94952
Western Petaluma NeighborhoodEstimated Value: $882,000 - $1,148,051
4
Beds
3
Baths
2,250
Sq Ft
$478/Sq Ft
Est. Value
About This Home
This home is located at 11 Brainerd Ave, Petaluma, CA 94952 and is currently estimated at $1,075,013, approximately $477 per square foot. 11 Brainerd Ave is a home located in Sonoma County with nearby schools including Valley Vista Elementary School, Petaluma Junior High School, and Petaluma High School.
Ownership History
Date
Name
Owned For
Owner Type
Purchase Details
Closed on
Feb 4, 2020
Sold by
Sanderson Troy J and Sanderson Tasha M
Bought by
Sanderson Troy J and Sanderson Tasha M
Current Estimated Value
Purchase Details
Closed on
Mar 14, 1996
Sold by
Sanderson Tasha
Bought by
Sanderson Troy
Purchase Details
Closed on
Sep 15, 1994
Sold by
Flagg Ronald
Bought by
Sanderson Troy J and Sanderson Tasha M
Home Financials for this Owner
Home Financials are based on the most recent Mortgage that was taken out on this home.
Original Mortgage
$180,000
Outstanding Balance
$100,071
Interest Rate
8.61%
Estimated Equity
$974,942
Create a Home Valuation Report for This Property
The Home Valuation Report is an in-depth analysis detailing your home's value as well as a comparison with similar homes in the area
Home Values in the Area
Average Home Value in this Area
Purchase History
| Date | Buyer | Sale Price | Title Company |
|---|---|---|---|
| Sanderson Troy J | -- | None Available | |
| Sanderson Troy J | -- | None Available | |
| Sanderson Troy | -- | Old Republic Title Company | |
| Sanderson Troy J | $238,000 | North American Title Company |
Source: Public Records
Mortgage History
| Date | Status | Borrower | Loan Amount |
|---|---|---|---|
| Open | Sanderson Troy J | $180,000 |
Source: Public Records
Tax History
| Year | Tax Paid | Tax Assessment Tax Assessment Total Assessment is a certain percentage of the fair market value that is determined by local assessors to be the total taxable value of land and additions on the property. | Land | Improvement |
|---|---|---|---|---|
| 2025 | $5,342 | $493,221 | $201,555 | $291,666 |
| 2024 | $5,342 | $483,551 | $197,603 | $285,948 |
| 2023 | $5,342 | $474,071 | $193,729 | $280,342 |
| 2022 | $5,146 | $464,777 | $189,931 | $274,846 |
| 2021 | $5,048 | $455,664 | $186,207 | $269,457 |
| 2020 | $5,091 | $450,993 | $184,298 | $266,695 |
| 2019 | $5,027 | $442,151 | $180,685 | $261,466 |
| 2018 | $5,007 | $433,483 | $177,143 | $256,340 |
| 2017 | $4,902 | $424,984 | $173,670 | $251,314 |
| 2016 | $4,782 | $416,652 | $170,265 | $246,387 |
| 2015 | $4,716 | $410,395 | $167,708 | $242,687 |
| 2014 | $4,692 | $402,357 | $164,423 | $237,934 |
Source: Public Records
Map
Nearby Homes
Your Personal Tour Guide
Ask me questions while you tour the home.