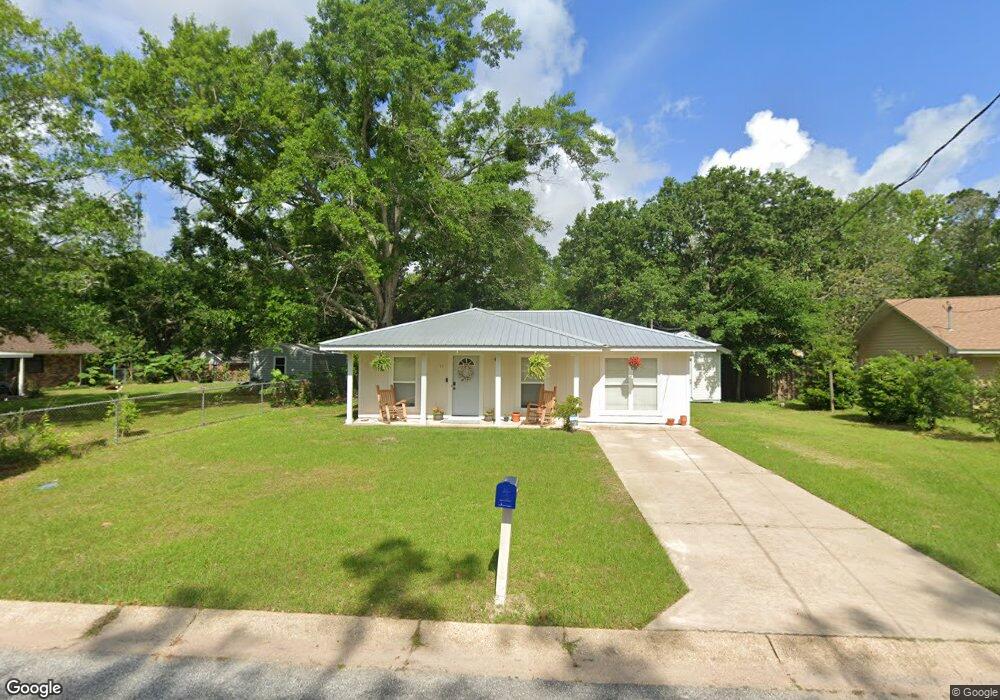
11 Bryant Ct Ocean Springs, MS 39564
Estimated Value: $184,000 - $210,000
3
Beds
1
Bath
1,440
Sq Ft
$136/Sq Ft
Est. Value
About This Home
This home is located at 11 Bryant Ct, Ocean Springs, MS 39564 and is currently estimated at $195,592, approximately $135 per square foot. 11 Bryant Ct is a home located in Jackson County with nearby schools including Magnolia Park Elementary School, Ocean Springs Middle School, and Ocean Springs High School.
Ownership History
Date
Name
Owned For
Owner Type
Purchase Details
Closed on
Aug 2, 2021
Sold by
Norsworthy Darrah and Norsworthy Derek
Bought by
Redmond Catherine R
Current Estimated Value
Home Financials for this Owner
Home Financials are based on the most recent Mortgage that was taken out on this home.
Original Mortgage
$7,000
Outstanding Balance
$6,365
Interest Rate
2.9%
Mortgage Type
Second Mortgage Made To Cover Down Payment
Estimated Equity
$189,227
Purchase Details
Closed on
May 20, 2011
Sold by
Helen Helen
Bought by
Harris Darrah
Create a Home Valuation Report for This Property
The Home Valuation Report is an in-depth analysis detailing your home's value as well as a comparison with similar homes in the area
Home Values in the Area
Average Home Value in this Area
Purchase History
| Date | Buyer | Sale Price | Title Company |
|---|---|---|---|
| Redmond Catherine R | -- | None Available | |
| Harris Darrah | -- | -- |
Source: Public Records
Mortgage History
| Date | Status | Borrower | Loan Amount |
|---|---|---|---|
| Open | Redmond Catherine R | $7,000 |
Source: Public Records
Tax History Compared to Growth
Tax History
| Year | Tax Paid | Tax Assessment Tax Assessment Total Assessment is a certain percentage of the fair market value that is determined by local assessors to be the total taxable value of land and additions on the property. | Land | Improvement |
|---|---|---|---|---|
| 2024 | $672 | $6,496 | $1,635 | $4,861 |
| 2023 | $672 | $6,496 | $1,635 | $4,861 |
| 2022 | $664 | $6,311 | $1,635 | $4,676 |
| 2021 | $659 | $6,366 | $1,635 | $4,731 |
| 2020 | $517 | $4,957 | $1,339 | $3,618 |
| 2019 | $514 | $4,957 | $1,339 | $3,618 |
| 2018 | $511 | $4,957 | $1,339 | $3,618 |
| 2017 | $511 | $4,957 | $1,339 | $3,618 |
| 2016 | $496 | $4,957 | $1,339 | $3,618 |
| 2015 | $430 | $41,600 | $13,390 | $28,210 |
| 2014 | $427 | $4,167 | $1,339 | $2,828 |
| 2013 | $643 | $6,497 | $1,821 | $4,676 |
Source: Public Records
Map
Nearby Homes