
Seller's Agent in 2021
Monique Maynard
East Key Realty
(603) 759-6160
2 in this area
45 Total Sales
Estimated Value: $409,132 - $432,000
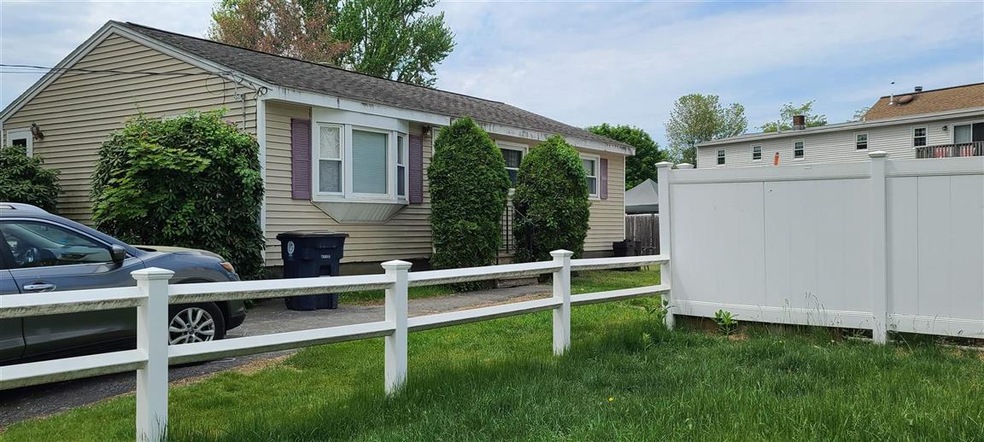
This home is located at 11 Burns St, Nashua, NH 03064 since 04 June 2021 and is currently estimated at $421,033, approximately $461 per square foot. This property was built in 1965. 11 Burns St is a home located in Hillsborough County with nearby schools including Amherst Street School, Pennichuck Middle School, and Nashua High School North.
Last Agent to Sell the Property
East Key Realty License #002281 Listed on: 06/04/2021
| Date | Buyer | Sale Price | Title Company |
|---|---|---|---|
| Evans Matthew | $279,933 | None Available | |
| Perry Kamieniecki Ret | -- | -- |
| Date | Status | Borrower | Loan Amount |
|---|---|---|---|
| Open | Evans Matthew | $274,829 |
| Date | Event | Price | List to Sale | Price per Sq Ft |
|---|---|---|---|---|
| 06/04/2021 06/04/21 | Sold | $279,900 | 0.0% | $307 / Sq Ft |
| 06/04/2021 06/04/21 | Pending | -- | -- | -- |
| 04/15/2021 04/15/21 | For Sale | $279,900 | -- | $307 / Sq Ft |
| Year | Tax Paid | Tax Assessment Tax Assessment Total Assessment is a certain percentage of the fair market value that is determined by local assessors to be the total taxable value of land and additions on the property. | Land | Improvement |
|---|---|---|---|---|
| 2024 | $5,993 | $376,900 | $124,000 | $252,900 |
| 2023 | $5,598 | $307,100 | $99,200 | $207,900 |
| 2022 | $5,549 | $307,100 | $99,200 | $207,900 |
| 2021 | $4,899 | $211,000 | $62,800 | $148,200 |
| 2020 | $4,782 | $211,500 | $62,800 | $148,700 |
| 2019 | $4,602 | $211,500 | $62,800 | $148,700 |
| 2018 | $4,486 | $211,500 | $62,800 | $148,700 |
| 2017 | $3,920 | $152,000 | $53,600 | $98,400 |
| 2016 | $3,811 | $152,000 | $53,600 | $98,400 |
| 2015 | $3,729 | $152,000 | $53,600 | $98,400 |
| 2014 | $3,656 | $152,000 | $53,600 | $98,400 |
Seller's Agent in 2021
Monique Maynard
East Key Realty
(603) 759-6160
2 in this area
45 Total Sales
Source: PrimeMLS
MLS Number: 4864888
APN: NASH-000130-000000-000076
Disclaimer: Certain information contained herein is derived from information provided by parties other than Homes.com. All information provided is deemed reliable, but is not guaranteed to be accurate and should be independently verified.
![]() Copyright 2025 PrimeMLS, Inc. All rights reserved. This information is deemed reliable, but not guaranteed. The data relating to real estate displayed on this display comes in part from the IDX Program of PrimeMLS. The information being provided is for consumers’ personal, non-commercial use and may not be used for any purpose other than to identify prospective properties consumers may be interested in purchasing.
Copyright 2025 PrimeMLS, Inc. All rights reserved. This information is deemed reliable, but not guaranteed. The data relating to real estate displayed on this display comes in part from the IDX Program of PrimeMLS. The information being provided is for consumers’ personal, non-commercial use and may not be used for any purpose other than to identify prospective properties consumers may be interested in purchasing.