11 Byron Dr Nashua, NH 03062
Southwest Nashua NeighborhoodEstimated Value: $682,000 - $750,000
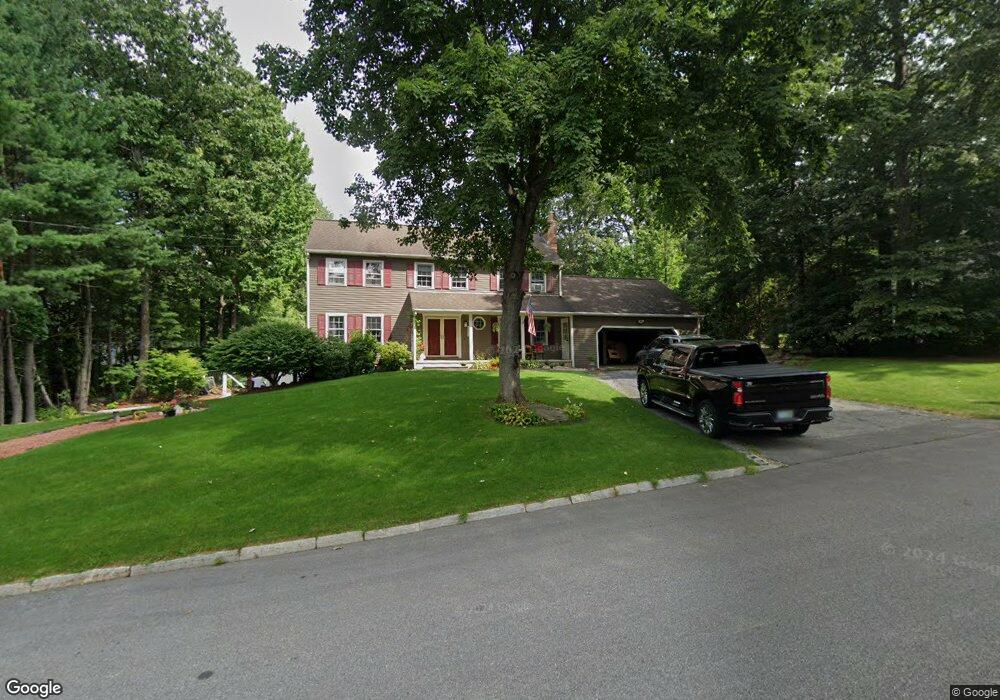
About This Home
This home is located at 11 Byron Dr, Nashua, NH 03062 and is currently estimated at $708,926, approximately $344 per square foot. 11 Byron Dr is a home located in Hillsborough County with nearby schools including Bicentennial Elementary School, Fairgrounds Middle School, and Nashua High School South.
Ownership History
We collect this data history from publicly available records. To have your information removed, we recommend requesting removal directly through your county’s website.
Purchase Details
Purchase Details
Home Financials for this Owner
Home Financials are based on the most recent Mortgage that was taken out on this home.Home Values in the Area
Average Home Value in this Area
Purchase History
We collect this data history from publicly available records. To have your information removed, we recommend requesting removal directly through your county’s website.
| Date | Buyer | Sale Price | Title Company |
|---|---|---|---|
| -- | None Available | ||
| $220,000 | -- |
Mortgage History
We collect this data history from publicly available records. To have your information removed, we recommend requesting removal directly through your county’s website.
| Date | Status | Borrower | Loan Amount |
|---|---|---|---|
| Previous Owner | $195,800 |
Tax History
We collect this data history from publicly available records. To have your information removed, we recommend requesting removal directly through your county’s website.
| Year | Tax Paid | Tax Assessment Tax Assessment Total Assessment is a certain percentage of the fair market value that is determined by local assessors to be the total taxable value of land and additions on the property. | Land | Improvement |
|---|---|---|---|---|
| 2025 | $10,544 | $626,500 | $180,800 | $445,700 |
| 2024 | $9,961 | $626,500 | $180,800 | $445,700 |
| 2023 | $9,525 | $522,500 | $144,700 | $377,800 |
| 2022 | $9,442 | $522,500 | $144,700 | $377,800 |
| 2021 | $8,896 | $383,100 | $106,100 | $277,000 |
| 2020 | $8,662 | $383,100 | $106,100 | $277,000 |
| 2019 | $8,336 | $383,100 | $106,100 | $277,000 |
| 2018 | $8,126 | $383,100 | $106,100 | $277,000 |
| 2017 | $8,387 | $325,200 | $91,700 | $233,500 |
| 2016 | $8,153 | $325,200 | $91,700 | $233,500 |
| 2015 | $7,977 | $325,200 | $91,700 | $233,500 |
| 2014 | $7,821 | $325,200 | $91,700 | $233,500 |
Map
- 21 Clearview Dr
- 57 Timberline Dr
- 4 Spindlewick Dr
- 10 Oakdale Ave
- 15 Masefield Rd
- 70 Spindlewick Dr
- 10 Timberline Dr
- 50 Spindlewick Dr
- 68 Robinson Rd
- 4 Percheron Cir
- 21 Hayden St
- 16 Marlowe Rd
- 27 Eastman St Unit 6062
- 37 W Glenwood St Unit 72
- 12 Burnett St Unit 115116
- 20 Taschereau Blvd
- 22 Greenwood Dr
- 256 E Dunstable Rd
- 2 Queensway Cir
- 122 Westwood Dr
Ask me questions while you tour the home.