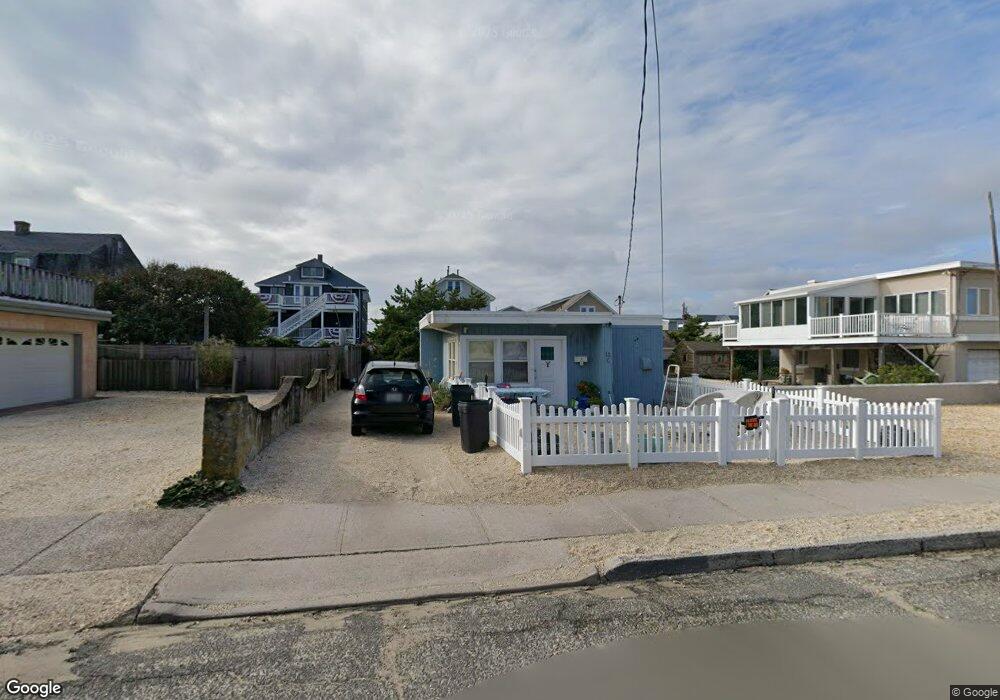
11 C St Seaside Park, NJ 08752
Estimated Value: $950,000 - $1,024,000
3
Beds
1
Bath
987
Sq Ft
$990/Sq Ft
Est. Value
About This Home
This home is located at 11 C St, Seaside Park, NJ 08752 and is currently estimated at $977,613, approximately $990 per square foot. 11 C St is a home located in Ocean County with nearby schools including Central Regional Middle School and Central Regional High School.
Ownership History
Date
Name
Owned For
Owner Type
Purchase Details
Closed on
Sep 13, 2025
Sold by
Kelsey Melissa M
Bought by
Kelsey Pauline Joan and Kelsey Melissa M
Current Estimated Value
Purchase Details
Closed on
Oct 7, 2024
Sold by
Kelsey Pauline Joan
Bought by
Kelsey Melissa Michele
Purchase Details
Closed on
Jan 16, 2017
Sold by
Kelsey Matthew Alan
Bought by
Kelsey Pauline Joan
Purchase Details
Closed on
Mar 9, 2011
Sold by
Kelsey Pauline Joan
Bought by
Kelsey Matthew Alan and Kelsey Pauline Joan
Purchase Details
Closed on
Apr 7, 2005
Sold by
Kelsey Alan G and Kelsey Pauline
Bought by
Kelsey Pauline
Purchase Details
Closed on
Sep 21, 2000
Sold by
Koc June
Bought by
Kelsey Alan and Kelsey Pauline
Home Financials for this Owner
Home Financials are based on the most recent Mortgage that was taken out on this home.
Original Mortgage
$247,500
Interest Rate
7.96%
Create a Home Valuation Report for This Property
The Home Valuation Report is an in-depth analysis detailing your home's value as well as a comparison with similar homes in the area
Home Values in the Area
Average Home Value in this Area
Purchase History
| Date | Buyer | Sale Price | Title Company |
|---|---|---|---|
| Kelsey Pauline Joan | -- | None Listed On Document | |
| Kelsey Melissa Michele | -- | None Listed On Document | |
| Kelsey Pauline Joan | -- | -- | |
| Kelsey Matthew Alan | -- | None Available | |
| Kelsey Pauline | -- | -- | |
| Kelsey Alan | $275,000 | -- | |
| Kelsey Alan | $275,000 | -- |
Source: Public Records
Mortgage History
| Date | Status | Borrower | Loan Amount |
|---|---|---|---|
| Previous Owner | Kelsey Alan | $247,500 |
Source: Public Records
Tax History Compared to Growth
Tax History
| Year | Tax Paid | Tax Assessment Tax Assessment Total Assessment is a certain percentage of the fair market value that is determined by local assessors to be the total taxable value of land and additions on the property. | Land | Improvement |
|---|---|---|---|---|
| 2025 | $8,954 | $547,300 | $478,000 | $69,300 |
| 2024 | $8,806 | $547,300 | $478,000 | $69,300 |
| 2023 | $8,494 | $547,300 | $478,000 | $69,300 |
| 2022 | $8,494 | $547,300 | $478,000 | $69,300 |
| 2021 | $8,313 | $547,300 | $478,000 | $69,300 |
| 2020 | $8,226 | $547,300 | $478,000 | $69,300 |
| 2019 | $8,138 | $547,300 | $478,000 | $69,300 |
| 2018 | $7,607 | $547,300 | $478,000 | $69,300 |
| 2017 | $7,722 | $547,300 | $478,000 | $69,300 |
| 2016 | $7,181 | $547,300 | $478,000 | $69,300 |
| 2015 | $7,493 | $547,300 | $478,000 | $69,300 |
| 2014 | $7,159 | $547,300 | $478,000 | $69,300 |
Source: Public Records
Map
Nearby Homes