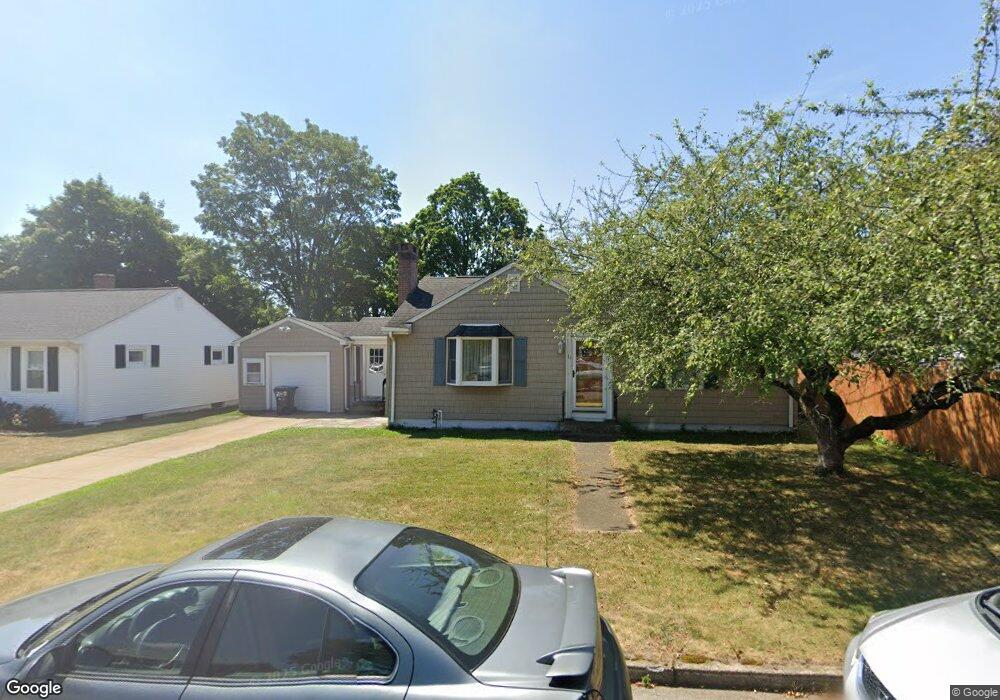
11 Cala Dr Pawtucket, RI 02861
Darlington NeighborhoodEstimated Value: $365,650 - $400,000
2
Beds
1
Bath
1,728
Sq Ft
$223/Sq Ft
Est. Value
About This Home
This home is located at 11 Cala Dr, Pawtucket, RI 02861 and is currently estimated at $385,663, approximately $223 per square foot. 11 Cala Dr is a home located in Providence County with nearby schools including St Cecilia School and Dayspring Christian Academy.
Ownership History
Date
Name
Owned For
Owner Type
Purchase Details
Closed on
Mar 7, 2000
Sold by
Kasparian Mary
Bought by
Lisi David P and Gilbert Diane C
Current Estimated Value
Home Financials for this Owner
Home Financials are based on the most recent Mortgage that was taken out on this home.
Original Mortgage
$81,750
Interest Rate
8.21%
Purchase Details
Closed on
Aug 10, 1994
Sold by
Ryder Virginia L Est
Bought by
Pappas Marion F and Kasparian Mary
Create a Home Valuation Report for This Property
The Home Valuation Report is an in-depth analysis detailing your home's value as well as a comparison with similar homes in the area
Home Values in the Area
Average Home Value in this Area
Purchase History
| Date | Buyer | Sale Price | Title Company |
|---|---|---|---|
| Lisi David P | $109,000 | -- | |
| Pappas Marion F | $105,000 | -- |
Source: Public Records
Mortgage History
| Date | Status | Borrower | Loan Amount |
|---|---|---|---|
| Closed | Pappas Marion F | $94,000 | |
| Closed | Pappas Marion F | $15,000 | |
| Closed | Pappas Marion F | $96,000 | |
| Closed | Pappas Marion F | $81,750 |
Source: Public Records
Tax History
| Year | Tax Paid | Tax Assessment Tax Assessment Total Assessment is a certain percentage of the fair market value that is determined by local assessors to be the total taxable value of land and additions on the property. | Land | Improvement |
|---|---|---|---|---|
| 2025 | $4,065 | $309,100 | $146,400 | $162,700 |
| 2024 | $3,814 | $309,100 | $146,400 | $162,700 |
| 2023 | $3,961 | $233,800 | $89,500 | $144,300 |
| 2022 | $3,876 | $233,800 | $89,500 | $144,300 |
| 2021 | $3,876 | $233,800 | $89,500 | $144,300 |
| 2020 | $3,806 | $182,200 | $78,000 | $104,200 |
| 2019 | $3,806 | $182,200 | $78,000 | $104,200 |
| 2018 | $3,668 | $182,200 | $78,000 | $104,200 |
| 2017 | $3,835 | $168,800 | $70,800 | $98,000 |
| 2016 | $3,695 | $168,800 | $70,800 | $98,000 |
| 2015 | $3,695 | $168,800 | $70,800 | $98,000 |
| 2014 | $3,300 | $143,100 | $59,000 | $84,100 |
Source: Public Records
Map
Nearby Homes
- 69 Clews St
- 15 Don Ct
- 26 Blackburn St
- 49 Ames St
- 888 Central Ave
- 39 Clinton St
- 70 Archer St
- 489 Benefit St
- 15 Draper St
- 34 Elmcrest Dr
- 496 Daggett Ave
- 41 Calder St
- 57 Cedarbrook Rd
- 141 Hanover Ave
- 65 Cedarbrook Rd
- 0 Cedar St
- 1346 Newport Ave
- 1346 Newport Ave Unit B-21
- 105 Metropolitan Park Ave
- 139 Suffolk Ave
Your Personal Tour Guide
Ask me questions while you tour the home.