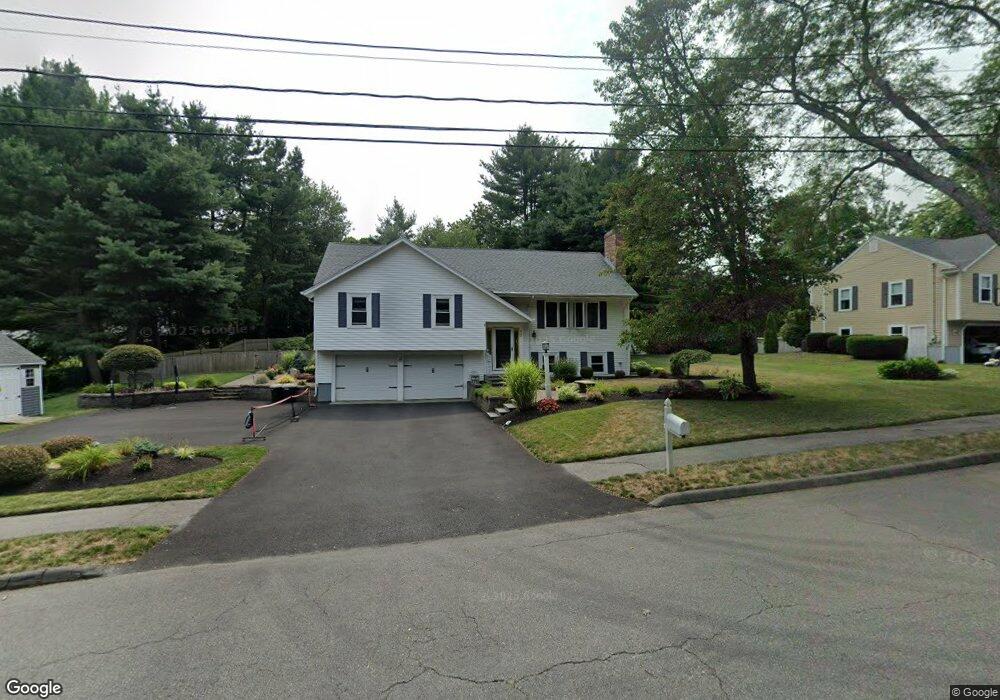
11 Calumet Rd Danvers, MA 01923
Estimated Value: $886,000 - $939,000
3
Beds
3
Baths
2,300
Sq Ft
$396/Sq Ft
Est. Value
About This Home
This home is located at 11 Calumet Rd, Danvers, MA 01923 and is currently estimated at $909,975, approximately $395 per square foot. 11 Calumet Rd is a home located in Essex County with nearby schools including Danvers High School, St. Mary of the Annunciation School, and St. John's Prep.
Ownership History
Date
Name
Owned For
Owner Type
Purchase Details
Closed on
Aug 14, 2012
Sold by
Ramsdell Alicia N and Ramsdell Paul H
Bought by
Ramsdell Alicia N and Ramsdell Paul H
Current Estimated Value
Home Financials for this Owner
Home Financials are based on the most recent Mortgage that was taken out on this home.
Original Mortgage
$395,000
Outstanding Balance
$274,023
Interest Rate
3.7%
Mortgage Type
Stand Alone Refi Refinance Of Original Loan
Estimated Equity
$635,952
Purchase Details
Closed on
Apr 3, 2009
Sold by
Blake John C and Blake Harriet L
Bought by
Botticelli Alicia N and Ramsdell Paul H
Purchase Details
Closed on
Jul 31, 2007
Sold by
Mcstay Shari B and Mcstay Steven P
Bought by
Blake John C and Blake Harriet L
Purchase Details
Closed on
Jan 3, 2000
Sold by
Lemieux Daniel J and Lemieux Debra
Bought by
Mcstay Steven P and Mcstay Shari B
Purchase Details
Closed on
Jun 26, 1995
Sold by
Nolan Leonard F and 11 Calumet Rd Rt
Bought by
Lemieux Daniel J and Lemieux Debra
Create a Home Valuation Report for This Property
The Home Valuation Report is an in-depth analysis detailing your home's value as well as a comparison with similar homes in the area
Home Values in the Area
Average Home Value in this Area
Purchase History
| Date | Buyer | Sale Price | Title Company |
|---|---|---|---|
| Ramsdell Alicia N | -- | -- | |
| Botticelli Alicia N | $470,000 | -- | |
| Blake John C | $560,000 | -- | |
| Mcstay Steven P | $340,000 | -- | |
| Lemieux Daniel J | $255,000 | -- |
Source: Public Records
Mortgage History
| Date | Status | Borrower | Loan Amount |
|---|---|---|---|
| Open | Lemieux Daniel J | $395,000 | |
| Previous Owner | Lemieux Daniel J | $396,650 |
Source: Public Records
Tax History
| Year | Tax Paid | Tax Assessment Tax Assessment Total Assessment is a certain percentage of the fair market value that is determined by local assessors to be the total taxable value of land and additions on the property. | Land | Improvement |
|---|---|---|---|---|
| 2025 | $8,659 | $787,900 | $376,200 | $411,700 |
| 2024 | $7,900 | $711,100 | $369,900 | $341,200 |
| 2023 | $7,640 | $650,200 | $338,600 | $311,600 |
| 2022 | $7,487 | $591,400 | $301,000 | $290,400 |
| 2021 | $7,844 | $587,600 | $297,200 | $290,400 |
| 2020 | $7,674 | $587,600 | $297,200 | $290,400 |
| 2019 | $7,425 | $559,100 | $269,600 | $289,500 |
| 2018 | $7,550 | $557,600 | $269,600 | $288,000 |
| 2017 | $7,101 | $500,400 | $232,000 | $268,400 |
| 2016 | $6,928 | $487,900 | $219,500 | $268,400 |
| 2015 | $6,687 | $448,500 | $200,600 | $247,900 |
Source: Public Records
Map
Nearby Homes
- 78 North St
- 4 Chatham Ln
- 2 Iroquois Rd
- 6 Colby Rd
- 466 Newbury St Unit 20
- 11 Spring St
- 200 North St Unit 31A
- 19 Bridle Spur Ln
- 12 Tulane Rd
- 3 Conrad Cir
- 40 Village Rd Unit 1210
- 40 Village Rd Unit 1006
- 2 Chapel Rd
- 244 Rowley Bridge Rd
- 35 Locust St Unit 3
- 38 Village Rd Unit 515
- 10 Maple St
- 36 Village Rd Unit 603
- 36 Village Rd Unit 506
- 55 Burley St
Your Personal Tour Guide
Ask me questions while you tour the home.