Estimated Value: $726,000 - $884,000
3
Beds
3
Baths
2,296
Sq Ft
$345/Sq Ft
Est. Value
About This Home
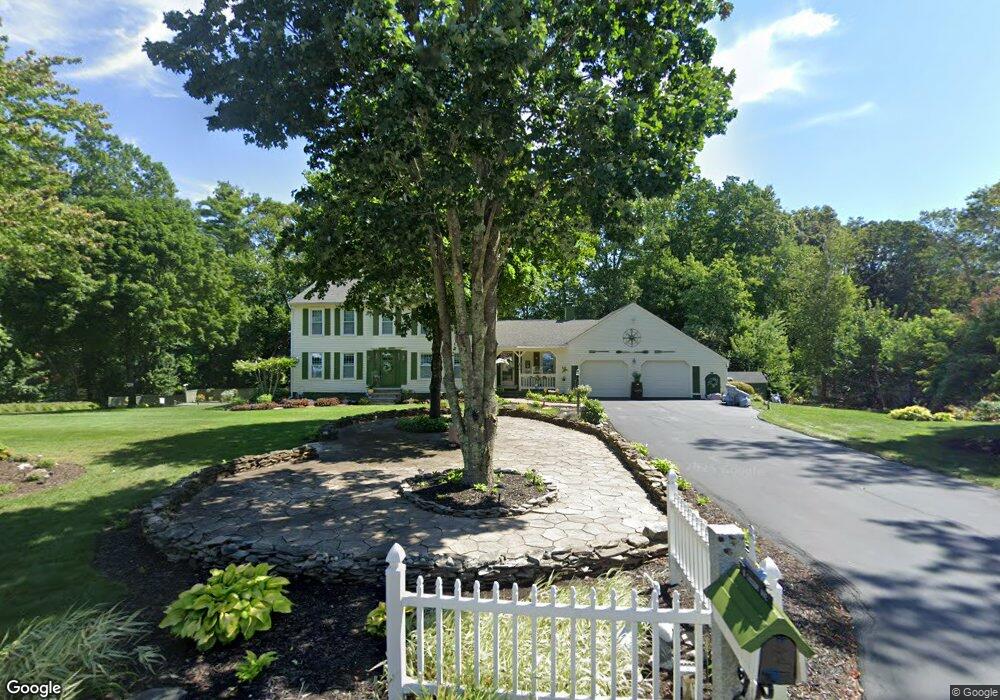
This home is located at 11 Cassidy Ave, Salem, NH 03079 and is currently estimated at $792,205, approximately $345 per square foot. 11 Cassidy Ave is a home located in Rockingham County with nearby schools including Mary A. Fisk Elementary School, Woodbury School, and Salem High School.
Ownership History
Date
Name
Owned For
Owner Type
Purchase Details
Closed on
Aug 11, 2021
Sold by
Walls Daniel J and Walls Elizabeth A
Bought by
Walls Ft
Current Estimated Value
Purchase Details
Closed on
Dec 5, 2003
Sold by
Ross James E and Ross Carol D
Bought by
Walls Daniel J and Walls Elizabeth A
Home Financials for this Owner
Home Financials are based on the most recent Mortgage that was taken out on this home.
Original Mortgage
$60,000
Interest Rate
6.03%
Mortgage Type
Purchase Money Mortgage
Create a Home Valuation Report for This Property
The Home Valuation Report is an in-depth analysis detailing your home's value as well as a comparison with similar homes in the area
Home Values in the Area
Average Home Value in this Area
Purchase History
| Date | Buyer | Sale Price | Title Company |
|---|---|---|---|
| Walls Ft | -- | None Available | |
| Walls Daniel J | $415,000 | -- |
Source: Public Records
Mortgage History
| Date | Status | Borrower | Loan Amount |
|---|---|---|---|
| Previous Owner | Walls Daniel J | $60,000 |
Source: Public Records
Tax History Compared to Growth
Tax History
| Year | Tax Paid | Tax Assessment Tax Assessment Total Assessment is a certain percentage of the fair market value that is determined by local assessors to be the total taxable value of land and additions on the property. | Land | Improvement |
|---|---|---|---|---|
| 2024 | $10,023 | $569,500 | $202,900 | $366,600 |
| 2023 | $9,659 | $569,500 | $202,900 | $366,600 |
| 2022 | $9,140 | $569,500 | $202,900 | $366,600 |
| 2021 | $9,101 | $569,500 | $202,900 | $366,600 |
| 2020 | $9,096 | $413,100 | $144,500 | $268,600 |
| 2019 | $9,080 | $413,100 | $144,500 | $268,600 |
| 2018 | $8,453 | $401,600 | $144,500 | $257,100 |
| 2017 | $8,205 | $401,600 | $144,500 | $257,100 |
| 2016 | $8,205 | $401,600 | $144,500 | $257,100 |
| 2015 | $7,489 | $350,100 | $143,800 | $206,300 |
| 2014 | $7,279 | $350,100 | $143,800 | $206,300 |
| 2013 | $7,163 | $350,100 | $143,800 | $206,300 |
Source: Public Records
Map
Nearby Homes
- 3 Sycamore Ave
- 6-18 Mary Anthony Dr
- 133 Brookdale Rd
- 38 Rosemary St
- 56 Nelson St
- 19A Winter St
- 92 Lowell Rd
- 26 Plower Rd Unit 6
- 108 S Shore Rd
- 3 Kennedy Dr
- 3 S Shore Rd
- 11 Surrey Ln
- 2 Baker Rd
- 75 S Policy St Unit 45
- 75 S Policy St Unit 48
- 1 Squire Armour Rd
- 45 Sharon Rd
- 17 Clinton St
- 3 Carmel Rd
- 39 Ticklefancy Ln