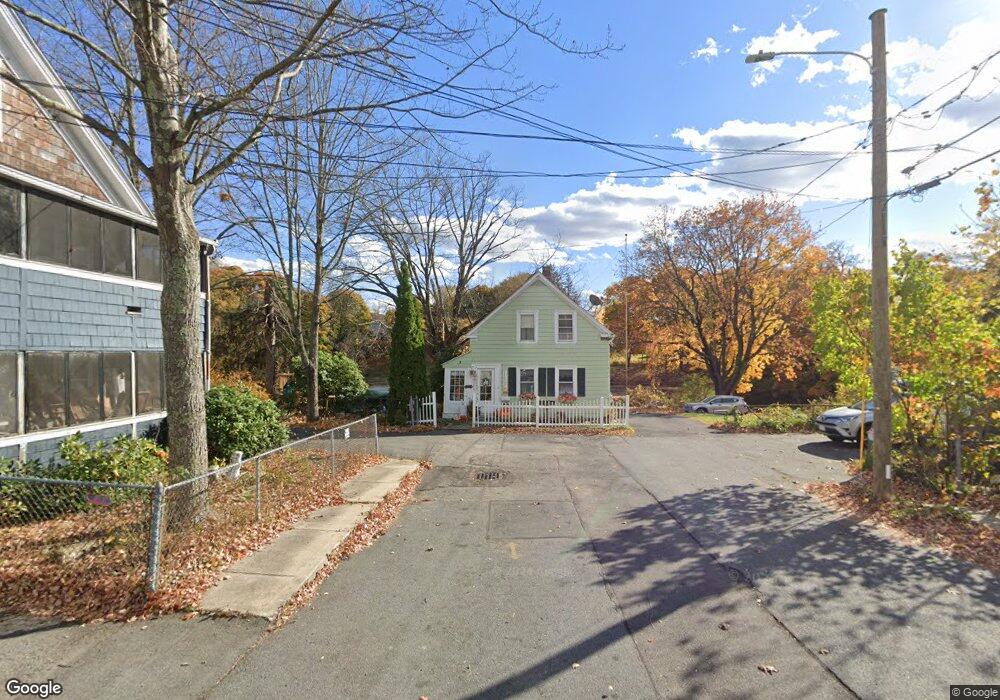
11 Cedar Ct Amesbury, MA 01913
Estimated Value: $545,000 - $605,000
3
Beds
2
Baths
1,407
Sq Ft
$407/Sq Ft
Est. Value
About This Home
This home is located at 11 Cedar Ct, Amesbury, MA 01913 and is currently estimated at $572,670, approximately $407 per square foot. 11 Cedar Ct is a home located in Essex County with nearby schools including Amesbury High School and Amesbury Seventh-Day Adventist School.
Ownership History
Date
Name
Owned For
Owner Type
Purchase Details
Closed on
Sep 22, 1995
Sold by
Shattler Ft
Bought by
Daigneault Robert W and Daigneault Daryl
Current Estimated Value
Home Financials for this Owner
Home Financials are based on the most recent Mortgage that was taken out on this home.
Original Mortgage
$105,000
Interest Rate
7.81%
Mortgage Type
Purchase Money Mortgage
Create a Home Valuation Report for This Property
The Home Valuation Report is an in-depth analysis detailing your home's value as well as a comparison with similar homes in the area
Home Values in the Area
Average Home Value in this Area
Purchase History
| Date | Buyer | Sale Price | Title Company |
|---|---|---|---|
| Daigneault Robert W | $120,000 | -- |
Source: Public Records
Mortgage History
| Date | Status | Borrower | Loan Amount |
|---|---|---|---|
| Open | Daigneault Robert W | $130,000 | |
| Closed | Daigneault Robert W | $120,000 | |
| Closed | Daigneault Robert W | $105,000 |
Source: Public Records
Tax History Compared to Growth
Tax History
| Year | Tax Paid | Tax Assessment Tax Assessment Total Assessment is a certain percentage of the fair market value that is determined by local assessors to be the total taxable value of land and additions on the property. | Land | Improvement |
|---|---|---|---|---|
| 2025 | $7,454 | $487,200 | $229,100 | $258,100 |
| 2024 | $7,044 | $450,400 | $216,200 | $234,200 |
| 2023 | $6,897 | $422,100 | $187,900 | $234,200 |
| 2022 | $6,294 | $355,800 | $163,400 | $192,400 |
| 2021 | $6,006 | $329,100 | $126,400 | $202,700 |
| 2020 | $5,334 | $310,500 | $121,500 | $189,000 |
| 2019 | $5,335 | $290,400 | $121,500 | $168,900 |
| 2018 | $5,135 | $270,400 | $115,700 | $154,700 |
| 2017 | $4,924 | $246,800 | $115,700 | $131,100 |
| 2016 | $4,808 | $237,100 | $115,700 | $121,400 |
| 2015 | $4,730 | $230,300 | $115,700 | $114,600 |
| 2014 | $4,565 | $217,700 | $115,700 | $102,000 |
Source: Public Records
Map
Nearby Homes
- 25 Cedar St Unit 4
- 25 Cedar St Unit 7
- 97 Elm St
- 5 Richs Ct Unit 3
- 53 Market St
- 101 Market St Unit B
- 101 Market St Unit A
- 103 Market St Unit A
- 103 Market St Unit B
- 105 Market St Unit B
- 7 Melrose St
- 22 Huntington Ave
- 37 Millyard Unit 204
- 161 Elm St Unit A
- 24 Aubin St Unit 2
- 43 Aubin St Unit 1
- 179 Elm St
- 48 Orchard St
- 81 High St Unit 27
- 100 Congress St