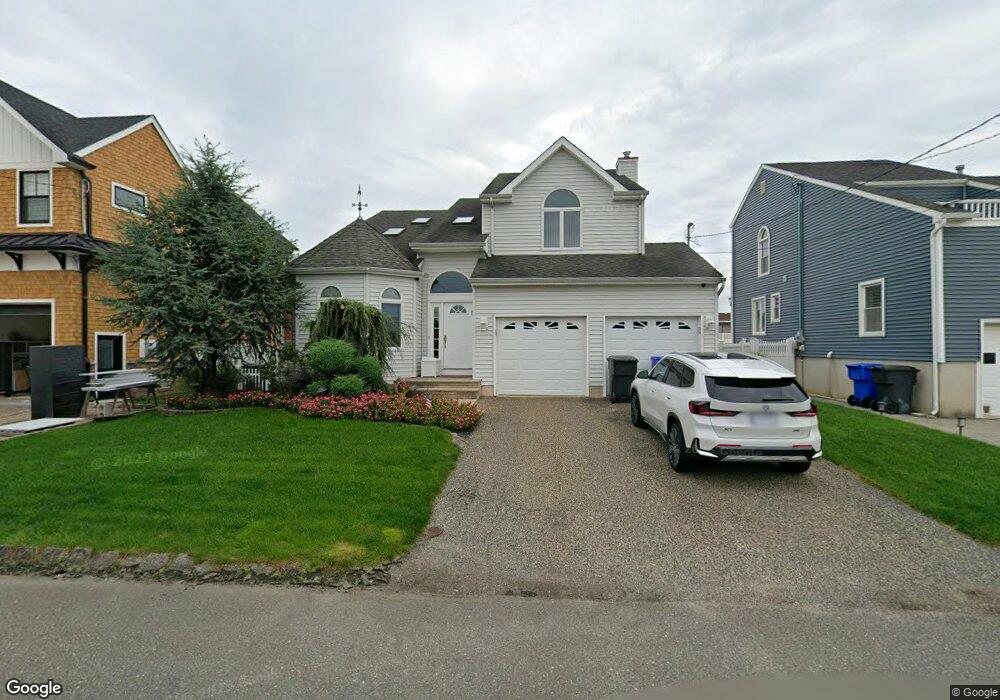
11 Channel Rd Toms River, NJ 08753
Estimated Value: $1,003,225 - $1,124,000
3
Beds
3
Baths
2,400
Sq Ft
$446/Sq Ft
Est. Value
About This Home
This home is located at 11 Channel Rd, Toms River, NJ 08753 and is currently estimated at $1,069,556, approximately $445 per square foot. 11 Channel Rd is a home located in Ocean County.
Ownership History
Date
Name
Owned For
Owner Type
Purchase Details
Closed on
Sep 21, 2000
Sold by
Home Mark Homes
Bought by
Walsh Thomas and Walsh Teresa
Current Estimated Value
Home Financials for this Owner
Home Financials are based on the most recent Mortgage that was taken out on this home.
Original Mortgage
$252,000
Outstanding Balance
$90,803
Interest Rate
7.94%
Estimated Equity
$978,753
Purchase Details
Closed on
Aug 23, 1999
Sold by
Ross Donald A
Bought by
Home Mark Homes Inc
Home Financials for this Owner
Home Financials are based on the most recent Mortgage that was taken out on this home.
Original Mortgage
$232,425
Interest Rate
7.8%
Mortgage Type
Construction
Create a Home Valuation Report for This Property
The Home Valuation Report is an in-depth analysis detailing your home's value as well as a comparison with similar homes in the area
Home Values in the Area
Average Home Value in this Area
Purchase History
| Date | Buyer | Sale Price | Title Company |
|---|---|---|---|
| Walsh Thomas | $339,900 | -- | |
| Walsh Thomas | $339,900 | -- | |
| Home Mark Homes Inc | $109,900 | First American Title Ins Co |
Source: Public Records
Mortgage History
| Date | Status | Borrower | Loan Amount |
|---|---|---|---|
| Open | Walsh Thomas | $252,000 | |
| Closed | Walsh Thomas | $252,000 | |
| Previous Owner | Home Mark Homes Inc | $232,425 |
Source: Public Records
Tax History Compared to Growth
Tax History
| Year | Tax Paid | Tax Assessment Tax Assessment Total Assessment is a certain percentage of the fair market value that is determined by local assessors to be the total taxable value of land and additions on the property. | Land | Improvement |
|---|---|---|---|---|
| 2025 | $12,450 | $683,300 | $245,000 | $438,300 |
| 2024 | $11,828 | $683,300 | $245,000 | $438,300 |
| 2023 | $11,397 | $683,300 | $245,000 | $438,300 |
| 2022 | $11,397 | $683,300 | $245,000 | $438,300 |
| 2021 | $10,479 | $419,500 | $165,800 | $253,700 |
| 2020 | $10,433 | $419,500 | $165,800 | $253,700 |
| 2019 | $9,980 | $419,500 | $165,800 | $253,700 |
| 2018 | $9,879 | $419,500 | $165,800 | $253,700 |
| 2017 | $9,812 | $419,500 | $165,800 | $253,700 |
| 2016 | $9,581 | $419,500 | $165,800 | $253,700 |
| 2015 | $9,237 | $419,500 | $165,800 | $253,700 |
| 2014 | $8,780 | $419,500 | $165,800 | $253,700 |
Source: Public Records
Map
Nearby Homes
- 8 Channel Rd
- 39 Woodhaven Rd
- 3 Harbor View Ln
- 37 Harbor View Ln
- 21 Holly Hill Dr
- 657 Bayview Dr
- 669 Bayview Dr
- 673 Bayview Dr
- 505 Bayview Dr
- 108 Longman St
- 4 Pine Bluff Rd
- 294 Jill Ct
- 316 Silver Lagoon Dr
- 52 16th St
- 266 Alabama Ave
- 259 Timberline Rd
- 13 Paul Jones Dr
- 240 Atsion Way
- 101 Reflection Rd
- 240 Timberline Rd