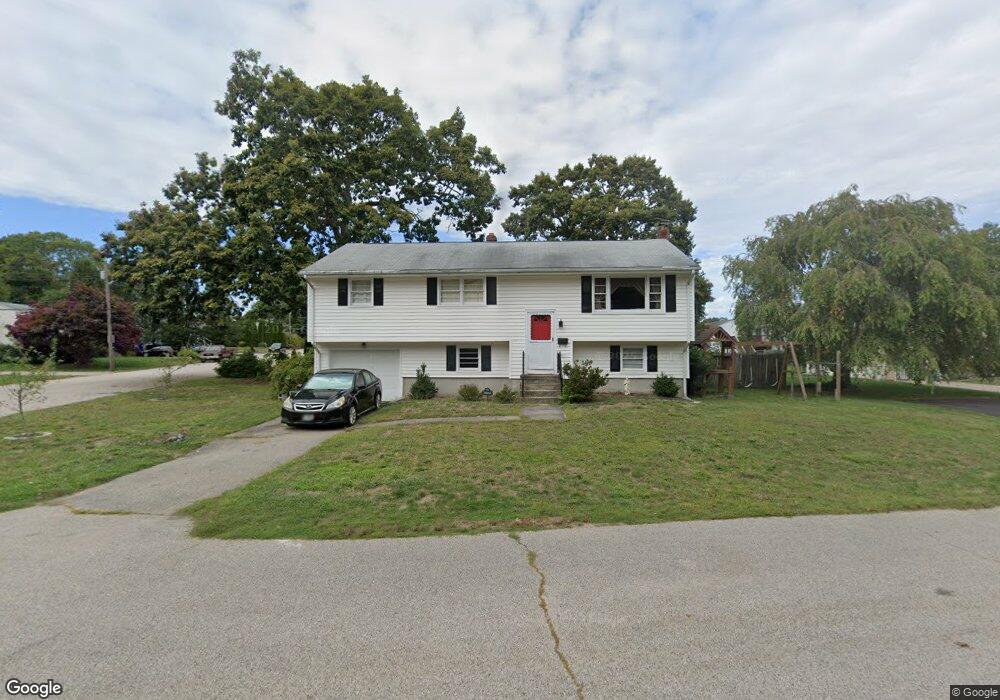
11 Chord St Westerly, RI 02891
Estimated Value: $452,295 - $498,000
3
Beds
2
Baths
1,576
Sq Ft
$302/Sq Ft
Est. Value
About This Home
This home is located at 11 Chord St, Westerly, RI 02891 and is currently estimated at $475,574, approximately $301 per square foot. 11 Chord St is a home located in Washington County with nearby schools including Westerly High School and St. Michael School.
Ownership History
Date
Name
Owned For
Owner Type
Purchase Details
Closed on
Feb 4, 2026
Sold by
Whitford Eric and Whitford Melissa M
Bought by
Whitford Eric
Current Estimated Value
Purchase Details
Closed on
Aug 25, 2015
Sold by
Tafone Paul and Tafone Maryann
Bought by
Whitford Eri and Whitford Melissa M
Purchase Details
Closed on
Mar 31, 2003
Sold by
Stillman Byron
Bought by
Tafone Paul and Tafone Maryann
Home Financials for this Owner
Home Financials are based on the most recent Mortgage that was taken out on this home.
Original Mortgage
$100,000
Interest Rate
5.91%
Mortgage Type
Purchase Money Mortgage
Create a Home Valuation Report for This Property
The Home Valuation Report is an in-depth analysis detailing your home's value as well as a comparison with similar homes in the area
Home Values in the Area
Average Home Value in this Area
Purchase History
We collect this data history from publicly available records. To have your information removed, we recommend requesting removal directly through your county’s website.
| Date | Buyer | Sale Price | Title Company |
|---|---|---|---|
| Whitford Eric | -- | -- | |
| Whitford Eri | $215,000 | -- | |
| Tafone Paul | $180,000 | -- |
Source: Public Records
Mortgage History
We collect this data history from publicly available records. To have your information removed, we recommend requesting removal directly through your county’s website.
| Date | Status | Borrower | Loan Amount |
|---|---|---|---|
| Previous Owner | Tafone Paul | $100,000 |
Source: Public Records
Tax History
| Year | Tax Paid | Tax Assessment Tax Assessment Total Assessment is a certain percentage of the fair market value that is determined by local assessors to be the total taxable value of land and additions on the property. | Land | Improvement |
|---|---|---|---|---|
| 2025 | $2,911 | $374,200 | $160,800 | $213,400 |
| 2024 | $3,133 | $299,800 | $114,800 | $185,000 |
| 2023 | $3,046 | $299,800 | $114,800 | $185,000 |
| 2022 | $3,028 | $299,800 | $114,800 | $185,000 |
| 2021 | $2,847 | $236,100 | $99,900 | $136,200 |
| 2020 | $2,798 | $236,100 | $99,900 | $136,200 |
| 2019 | $2,772 | $236,100 | $99,900 | $136,200 |
| 2018 | $2,659 | $215,300 | $99,900 | $115,400 |
| 2017 | $2,584 | $215,300 | $99,900 | $115,400 |
| 2016 | $2,584 | $215,300 | $99,900 | $115,400 |
| 2015 | $2,440 | $217,300 | $101,900 | $115,400 |
| 2014 | $2,401 | $217,300 | $101,900 | $115,400 |
Source: Public Records
Map
Nearby Homes
- 9 Apache Dr Unit D
- 36 Ledward Ave
- 19 Apache Dr Unit F
- 15 Blue Heron Dr
- 42 Westminster St
- 21 North Dr
- 38 School St
- 2 Marichris Dr
- 25 School St Unit 2
- 6 Wilder Ave
- 23 Abbey Ln Unit 12
- 24 Abbey Ln Unit 13
- 23 Newton Ave
- 6 Marion St
- 14 Meadow Lark Dr
- 70 Margin St
- 17 West St Unit 3
- 21 Chase St
- 52 Moss St
- 166 High St
Your Personal Tour Guide
Ask me questions while you tour the home.