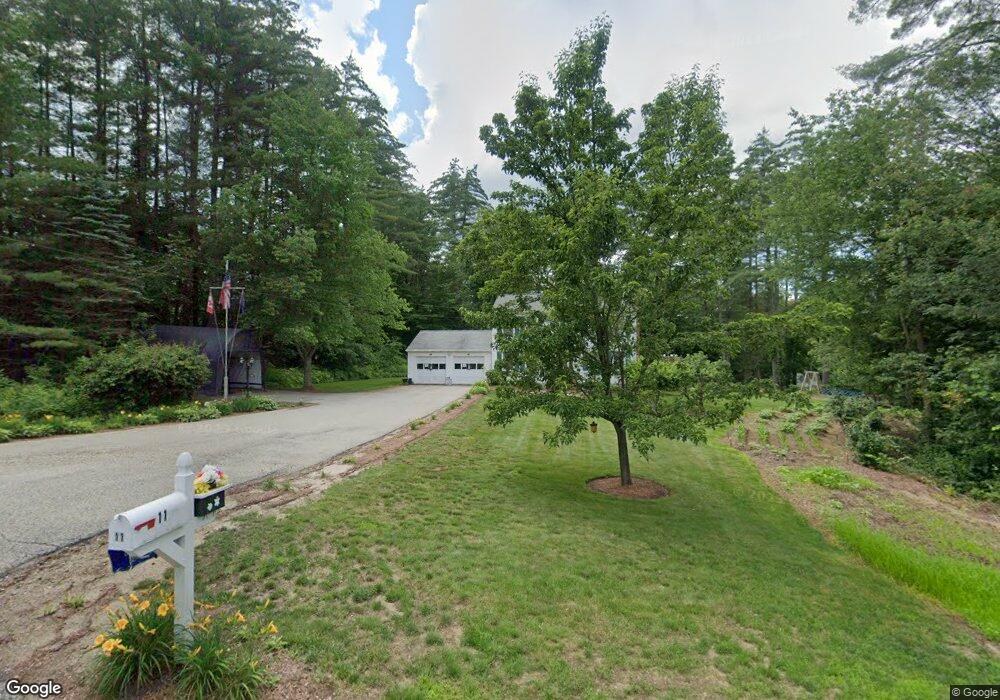
11 Clancy Dr Goffstown, NH 03045
Estimated Value: $454,000 - $588,000
3
Beds
2
Baths
1,632
Sq Ft
$323/Sq Ft
Est. Value
About This Home
This home is located at 11 Clancy Dr, Goffstown, NH 03045 and is currently estimated at $527,234, approximately $323 per square foot. 11 Clancy Dr is a home with nearby schools including Mountain View Middle School and Goffstown High School.
Ownership History
Date
Name
Owned For
Owner Type
Purchase Details
Closed on
Aug 6, 2020
Sold by
Soucy Steven and Soucy Janet M
Bought by
Steven & Janet Soucy Ft and Soucy
Current Estimated Value
Purchase Details
Closed on
Aug 15, 1988
Bought by
Soucy Steven M
Create a Home Valuation Report for This Property
The Home Valuation Report is an in-depth analysis detailing your home's value as well as a comparison with similar homes in the area
Home Values in the Area
Average Home Value in this Area
Purchase History
We collect this data history from publicly available records. To have your information removed, we recommend requesting removal directly through your county’s website.
| Date | Buyer | Sale Price | Title Company |
|---|---|---|---|
| Steven & Janet Soucy Ft | -- | None Available | |
| Steven & Janet Soucy Ft | -- | None Available | |
| Soucy Steven M | -- | -- |
Source: Public Records
Mortgage History
We collect this data history from publicly available records. To have your information removed, we recommend requesting removal directly through your county’s website.
| Date | Status | Borrower | Loan Amount |
|---|---|---|---|
| Previous Owner | Soucy Steven M | $179,000 | |
| Previous Owner | Soucy Steven M | $100,000 |
Source: Public Records
Tax History
| Year | Tax Paid | Tax Assessment Tax Assessment Total Assessment is a certain percentage of the fair market value that is determined by local assessors to be the total taxable value of land and additions on the property. | Land | Improvement |
|---|---|---|---|---|
| 2025 | $8,615 | $412,600 | $186,400 | $226,200 |
| 2024 | $8,434 | $412,600 | $186,400 | $226,200 |
| 2023 | $7,782 | $412,600 | $186,400 | $226,200 |
| 2022 | $7,193 | $273,400 | $123,200 | $150,200 |
| 2021 | $6,786 | $273,400 | $123,200 | $150,200 |
| 2020 | $6,786 | $273,400 | $123,200 | $150,200 |
| 2019 | $6,720 | $273,400 | $123,200 | $150,200 |
| 2018 | $5,085 | $273,400 | $123,200 | $150,200 |
| 2017 | $6,499 | $237,000 | $101,400 | $135,600 |
| 2016 | $6,264 | $237,000 | $101,400 | $135,600 |
| 2015 | $6,111 | $217,000 | $94,900 | $122,100 |
| 2014 | $5,859 | $217,000 | $94,900 | $122,100 |
Source: Public Records
Map
Nearby Homes
- 112 Mountain Rd
- 102 Mountain Rd
- 26 Pineridge St
- 23 Pineridge St
- 47 E Union St
- 120 S Mast St
- 00 Bog Brook Rd Unit multiple
- 101 Elm St
- 27B Apple Tree Dr Unit B
- 130 Elm St
- 22B Angel Point Cir
- 189 Byam Rd
- 220 Riverdale Rd
- Map 6 Lot 40 River Rd
- 7 Rainbow Dr
- 541 Bedford Rd
- 4 Birch Ct
- 370 Mccurdy Rd
- 254 Normand Rd
- 234 Paige Hill Rd
Your Personal Tour Guide
Ask me questions while you tour the home.