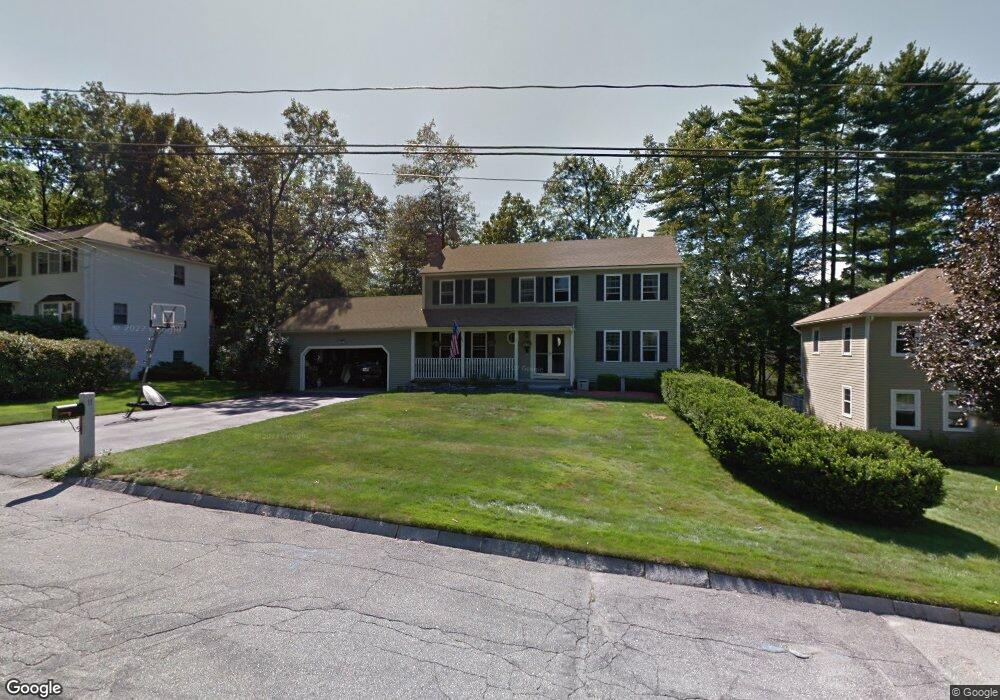
11 Clear View Dr Nashua, NH 03062
Southwest Nashua NeighborhoodEstimated Value: $620,000 - $691,000
4
Beds
3
Baths
2,058
Sq Ft
$317/Sq Ft
Est. Value
About This Home
This home is located at 11 Clear View Dr, Nashua, NH 03062 and is currently estimated at $653,319, approximately $317 per square foot. 11 Clear View Dr is a home located in Hillsborough County with nearby schools including Bicentennial Elementary School, Fairgrounds Middle School, and Nashua High School South.
Ownership History
Date
Name
Owned For
Owner Type
Purchase Details
Closed on
Aug 31, 2023
Sold by
Conte Kenneth J and Conte Tammy R
Bought by
Kenneth & Tammy Conte Lt and Conte
Current Estimated Value
Purchase Details
Closed on
Jul 3, 2001
Sold by
Schellhammer Richard J and Schellhammer Barbara K
Bought by
Conte Kenneth J
Create a Home Valuation Report for This Property
The Home Valuation Report is an in-depth analysis detailing your home's value as well as a comparison with similar homes in the area
Home Values in the Area
Average Home Value in this Area
Purchase History
| Date | Buyer | Sale Price | Title Company |
|---|---|---|---|
| Kenneth & Tammy Conte Lt | -- | None Available | |
| Conte Kenneth J | $274,900 | -- |
Source: Public Records
Mortgage History
| Date | Status | Borrower | Loan Amount |
|---|---|---|---|
| Previous Owner | Conte Kenneth J | $80,000 | |
| Previous Owner | Conte Kenneth J | $223,248 | |
| Previous Owner | Conte Kenneth J | $60,000 | |
| Previous Owner | Conte Kenneth J | $80,000 |
Source: Public Records
Tax History Compared to Growth
Tax History
| Year | Tax Paid | Tax Assessment Tax Assessment Total Assessment is a certain percentage of the fair market value that is determined by local assessors to be the total taxable value of land and additions on the property. | Land | Improvement |
|---|---|---|---|---|
| 2024 | $9,666 | $607,900 | $168,600 | $439,300 |
| 2023 | $9,226 | $506,100 | $135,000 | $371,100 |
| 2022 | $9,145 | $506,100 | $135,000 | $371,100 |
| 2021 | $8,608 | $370,700 | $98,900 | $271,800 |
| 2020 | $8,382 | $370,700 | $98,900 | $271,800 |
| 2019 | $8,066 | $370,700 | $98,900 | $271,800 |
| 2018 | $7,863 | $370,700 | $98,900 | $271,800 |
| 2017 | $8,008 | $310,500 | $85,400 | $225,100 |
| 2016 | $7,784 | $310,500 | $85,400 | $225,100 |
| 2015 | $7,617 | $310,500 | $85,400 | $225,100 |
| 2014 | $7,468 | $310,500 | $85,400 | $225,100 |
Source: Public Records
Map
Nearby Homes
- 9 Byron Dr
- 125 Lille Rd
- 61 Spindlewick Dr
- 29 Dickens St
- 5 Appaloosa Place
- 17 Herrick St
- 59 Pike St
- 15 Learned St Unit 123
- 36 Eastman St Unit 26
- 6 Hayden St
- 57 Wethersfield Rd
- 285 E Dunstable Rd
- 29 Greenwood Dr
- 10 Lamb Rd
- 23 Glen Dr
- 73 Bluestone Dr
- 85 Bluestone Dr
- 92 Bluestone Dr
- 2 Wakefield Dr
- 7 Fairhaven Rd