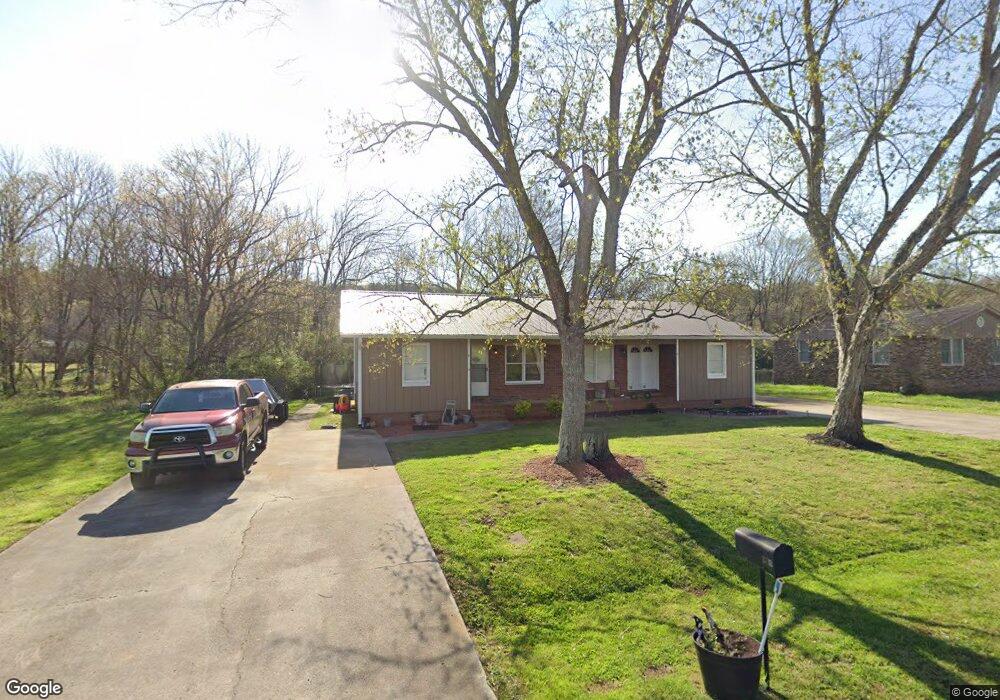
11 Conns Lake Rd SE Lindale, GA 30147
Estimated Value: $199,000 - $231,000
--
Bed
2
Baths
2,212
Sq Ft
$97/Sq Ft
Est. Value
About This Home
This home is located at 11 Conns Lake Rd SE, Lindale, GA 30147 and is currently estimated at $214,817, approximately $97 per square foot. 11 Conns Lake Rd SE is a home located in Floyd County with nearby schools including Pepperell Middle School and Pepperell High School.
Ownership History
Date
Name
Owned For
Owner Type
Purchase Details
Closed on
Nov 5, 2020
Sold by
K & P Commercial Properties Llc
Bought by
Sipp Tom
Current Estimated Value
Purchase Details
Closed on
Jun 2, 2017
Sold by
Phillip Williams H
Bought by
K
Home Financials for this Owner
Home Financials are based on the most recent Mortgage that was taken out on this home.
Original Mortgage
$62,400
Interest Rate
4.02%
Mortgage Type
New Conventional
Purchase Details
Closed on
Apr 11, 2005
Bought by
P and R
Purchase Details
Closed on
Nov 30, 1999
Sold by
Evans Lamar
Bought by
Willia Williams H and Willia Susan J
Purchase Details
Closed on
Aug 1, 1984
Sold by
Roberson Dan
Bought by
Evans Lamar
Purchase Details
Closed on
May 21, 1980
Sold by
Morgan John S
Bought by
Roberson Dan
Purchase Details
Closed on
Mar 7, 1980
Sold by
Jackson Morgan D
Bought by
Morgan John S
Purchase Details
Closed on
Oct 31, 1976
Sold by
Citizen Service Co
Bought by
Jackson Morgan D
Purchase Details
Closed on
Mar 2, 1972
Bought by
Citizen Service Co
Create a Home Valuation Report for This Property
The Home Valuation Report is an in-depth analysis detailing your home's value as well as a comparison with similar homes in the area
Home Values in the Area
Average Home Value in this Area
Purchase History
| Date | Buyer | Sale Price | Title Company |
|---|---|---|---|
| Sipp Tom | $100,000 | -- | |
| K | $78,000 | -- | |
| Phillip Williams H | -- | -- | |
| P | -- | -- | |
| Willia Williams H | $75,000 | -- | |
| Evans Lamar | $3,500 | -- | |
| Roberson Dan | $1,500 | -- | |
| Morgan John S | -- | -- | |
| Jackson Morgan D | -- | -- | |
| Citizen Service Co | -- | -- |
Source: Public Records
Mortgage History
| Date | Status | Borrower | Loan Amount |
|---|---|---|---|
| Previous Owner | Phillip Williams H | $62,400 |
Source: Public Records
Tax History Compared to Growth
Tax History
| Year | Tax Paid | Tax Assessment Tax Assessment Total Assessment is a certain percentage of the fair market value that is determined by local assessors to be the total taxable value of land and additions on the property. | Land | Improvement |
|---|---|---|---|---|
| 2024 | $2,130 | $69,565 | $14,784 | $54,781 |
| 2023 | $1,990 | $66,635 | $13,440 | $53,195 |
| 2022 | $1,685 | $56,808 | $12,800 | $44,008 |
| 2021 | $1,207 | $42,642 | $6,400 | $36,242 |
| 2020 | $1,387 | $45,556 | $5,000 | $40,556 |
| 2019 | $1,217 | $40,513 | $5,000 | $35,513 |
| 2018 | $939 | $36,368 | $5,000 | $31,368 |
| 2017 | $1,064 | $35,308 | $5,000 | $30,308 |
| 2016 | $1,016 | $33,298 | $5,000 | $28,298 |
| 2015 | $994 | $33,298 | $5,000 | $28,298 |
| 2014 | $994 | $33,298 | $5,000 | $28,298 |
Source: Public Records
Map
Nearby Homes
- 81 Hughes Dairy Rd
- 1380 Old Cedartown Rd SE
- 184 Conns Lake Extension
- 0 Booze Mountain Rd Unit 10580353
- 27 Hughes Dairy Rd SE
- 4 The Trail SE
- 12 Indian River Rd SE
- 413 Blackberry Ln SE
- 514 Booze Mountain Rd SE
- 185 Marion Dairy Rd SE
- 19 Silver Hills Rd SE
- 1572 Booze Mountain Rd SE
- 0 Wedgewood Dr
- 311 Park Ave SE
- 305 Grove Ave SE
- 1 Van Tassel Dr SE
- 16 Timberwood Dr SE
- 608 Eden Valley Rd SE
- 13 N Terrace Ave SE
- 65 Vanns Valley Rd SW
- 13 Conns Lake Rd SE
- 15 Conns Lake Rd SE
- 12 Conns Lake Rd SE
- 10 Conns Lake Rd SE
- 14 Conns Lake Rd SE
- 17 Conns Lake Rd SE
- 16 Conns Lake Rd SE Unit 27
- 16 Conns Lake Rd SE
- 1214 Old Cedartown Hwy SE
- 1226 Old Cedartown Rd SE
- 1254 Old Cedartown Rd SE
- 18 Conns Lake Rd SE
- 19 Conns Lake Rd SE
- 1207 Old Cedartown Hwy SE
- 1207 Old Cedartown Hwy SE
- 1276 Old Cedartown Hwy SE
- 20 Conns Lake Rd SE
- 0 Lakeview Dr SE Unit LOT 65 2671640
- 1204 Old Cedartown Hwy SE
- 1204 Old Cedartown Hwy SE