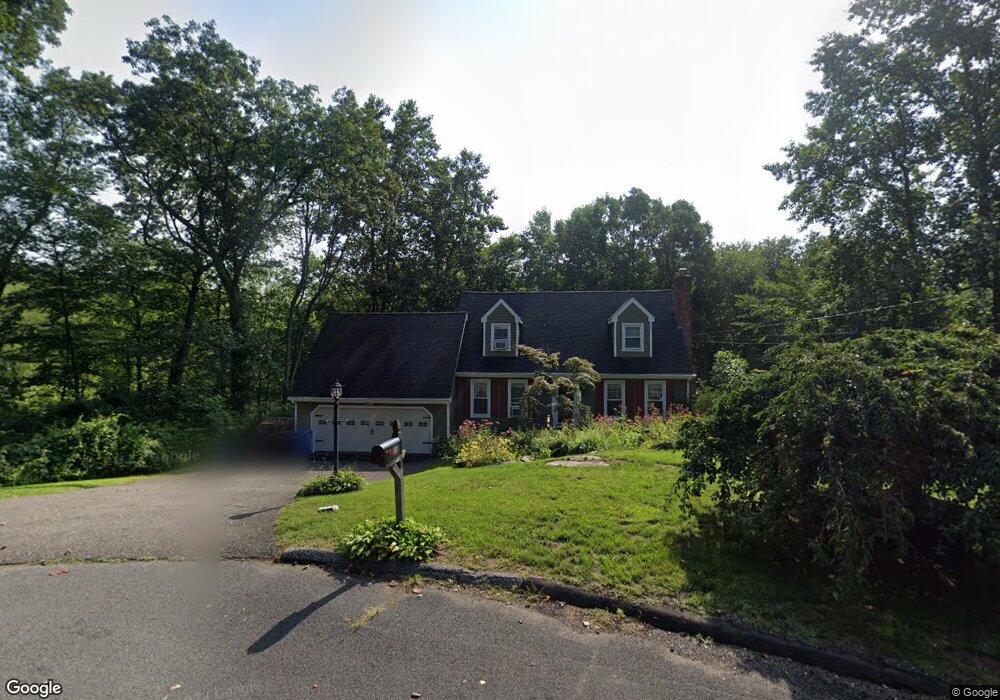
11 Corn Hill Rd Shelton, CT 06484
Estimated Value: $617,466 - $665,000
3
Beds
3
Baths
1,638
Sq Ft
$396/Sq Ft
Est. Value
About This Home
This home is located at 11 Corn Hill Rd, Shelton, CT 06484 and is currently estimated at $648,367, approximately $395 per square foot. 11 Corn Hill Rd is a home located in Fairfield County with nearby schools including Perry Hill School, Shelton Intermediate School, and Shelton High School.
Ownership History
Date
Name
Owned For
Owner Type
Purchase Details
Closed on
Oct 11, 2021
Sold by
Oppel Raymond A and Oppel Deborah J
Bought by
Deborah Joan Oppel Ret
Current Estimated Value
Purchase Details
Closed on
Dec 28, 2001
Sold by
Smeriglio David A and Malec Pamela A
Bought by
Oppel Raymond A and Oppel Deborah J
Purchase Details
Closed on
Feb 1, 2000
Sold by
Meyers James S and Meyers Patricia A
Bought by
Melec Pamela A and Smeriglio David A
Purchase Details
Closed on
Jan 17, 1997
Sold by
Grosskopf Richadr and Davin Julie
Bought by
Meyers James S and Meyers Patricia
Purchase Details
Closed on
Aug 10, 1993
Sold by
Oconnor Paul
Bought by
Grosskoff Richard and Davin Julia
Create a Home Valuation Report for This Property
The Home Valuation Report is an in-depth analysis detailing your home's value as well as a comparison with similar homes in the area
Home Values in the Area
Average Home Value in this Area
Purchase History
| Date | Buyer | Sale Price | Title Company |
|---|---|---|---|
| Deborah Joan Oppel Ret | -- | None Available | |
| Deborah Joan Oppel Ret | -- | None Available | |
| Oppel Raymond A | $315,000 | -- | |
| Oppel Raymond A | $315,000 | -- | |
| Melec Pamela A | $267,000 | -- | |
| Melec Pamela A | $267,000 | -- | |
| Meyers James S | $203,000 | -- | |
| Meyers James S | $203,000 | -- | |
| Grosskoff Richard | $210,000 | -- | |
| Grosskoff Richard | $210,000 | -- |
Source: Public Records
Mortgage History
| Date | Status | Borrower | Loan Amount |
|---|---|---|---|
| Previous Owner | Grosskoff Richard | $200,000 | |
| Previous Owner | Grosskoff Richard | $78,500 |
Source: Public Records
Tax History Compared to Growth
Tax History
| Year | Tax Paid | Tax Assessment Tax Assessment Total Assessment is a certain percentage of the fair market value that is determined by local assessors to be the total taxable value of land and additions on the property. | Land | Improvement |
|---|---|---|---|---|
| 2025 | $6,204 | $329,630 | $113,120 | $216,510 |
| 2024 | $6,322 | $329,630 | $113,120 | $216,510 |
| 2023 | $5,759 | $329,630 | $113,120 | $216,510 |
| 2022 | $5,759 | $329,630 | $113,120 | $216,510 |
| 2021 | $5,179 | $235,070 | $61,530 | $173,540 |
| 2020 | $5,270 | $235,060 | $61,530 | $173,530 |
| 2019 | $5,270 | $235,060 | $61,530 | $173,530 |
| 2017 | $5,221 | $235,070 | $61,530 | $173,540 |
| 2015 | $5,493 | $246,190 | $65,730 | $180,460 |
| 2014 | $5,492 | $246,190 | $65,730 | $180,460 |
Source: Public Records
Map
Nearby Homes
- 60 Country Ridge Dr
- 19 Hazel Ct
- 15 Winthrop Dr
- 32 Adams Dr
- 65 Cloverdale Ave
- 8 Capitol Dr
- 2 Steeple View Ln
- 6 Steeple View Ln Unit Lot 7
- 14 Steeple View Ln
- 1 Steeple View Ln
- 15 Windy Acres Dr
- 3 Yale Ave
- 229 Mohegan Rd
- 118 Greenbrier Rd
- 23 Bonita Dr
- 225 Nichols Ave
- 24 Cedar Hill Rd
- 23 Sportsman Dr
- 28 Strawberry Ln
- 88 Sorghum Rd
- 16 Corn Hill Rd
- 14 Corn Hill Rd
- 49 Windsor Rd
- 5 Corn Hill Rd
- 15 Copper Penny Ln
- 6 Corn Hill Rd
- 19 Copper Penny Ln
- 20 Horse Stable Cir
- 45 Windsor Rd
- 41 Windsor Rd
- 23 Copper Penny Ln
- 62 Windsor Rd
- 66 Windsor Rd
- 9 Copper Penny Ln
- 1 Corn Hill Rd
- 58 Windsor Rd
- 54 Windsor Rd
- 15 Horse Stable Cir
- 18 Copper Penny Ln
- 27 Copper Penny Ln