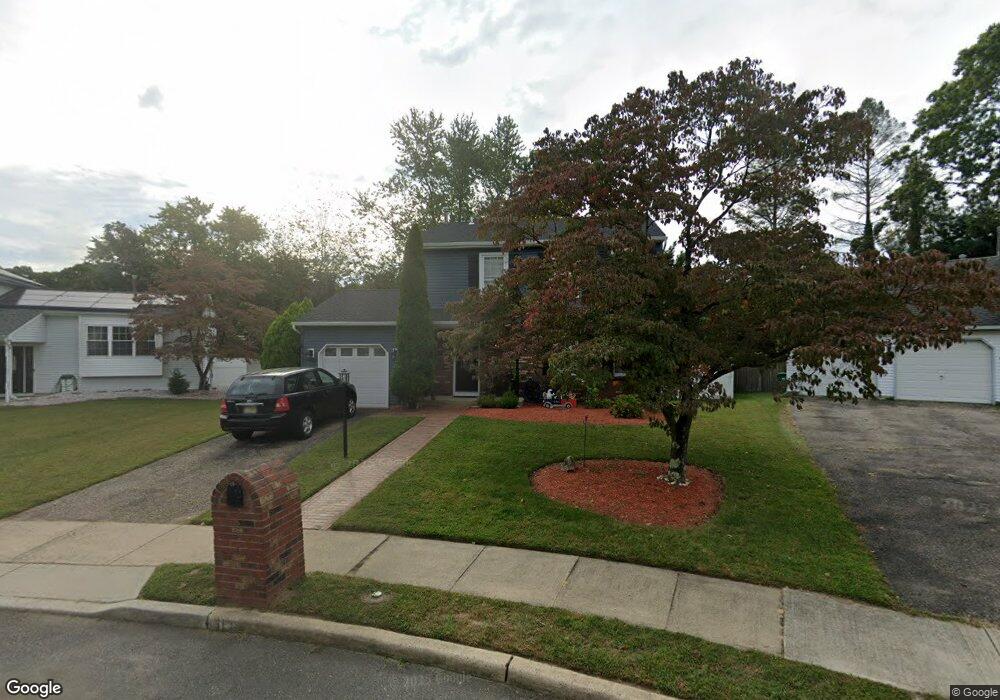
11 Cove Ct Howell, NJ 07731
Southard NeighborhoodEstimated Value: $624,000 - $695,000
3
Beds
3
Baths
1,421
Sq Ft
$464/Sq Ft
Est. Value
About This Home
This home is located at 11 Cove Ct, Howell, NJ 07731 and is currently estimated at $659,929, approximately $464 per square foot. 11 Cove Ct is a home located in Monmouth County with nearby schools including Taunton School, Aldrich School, and Howell Township Middle School South.
Ownership History
Date
Name
Owned For
Owner Type
Purchase Details
Closed on
Feb 16, 2011
Sold by
Guarneri Gregory and Guarneri Karen D
Bought by
Brady Keith
Current Estimated Value
Home Financials for this Owner
Home Financials are based on the most recent Mortgage that was taken out on this home.
Original Mortgage
$336,254
Outstanding Balance
$231,072
Interest Rate
4.87%
Mortgage Type
FHA
Estimated Equity
$428,857
Purchase Details
Closed on
Apr 25, 2003
Sold by
Newman Ira
Bought by
Guarneri Gregory and Guarneri Karen
Home Financials for this Owner
Home Financials are based on the most recent Mortgage that was taken out on this home.
Original Mortgage
$258,000
Interest Rate
5.46%
Purchase Details
Closed on
Jun 16, 1995
Sold by
Hite Jeffrey
Bought by
Kimel Phyllis
Home Financials for this Owner
Home Financials are based on the most recent Mortgage that was taken out on this home.
Original Mortgage
$133,000
Interest Rate
7.86%
Create a Home Valuation Report for This Property
The Home Valuation Report is an in-depth analysis detailing your home's value as well as a comparison with similar homes in the area
Home Values in the Area
Average Home Value in this Area
Purchase History
| Date | Buyer | Sale Price | Title Company |
|---|---|---|---|
| Brady Keith | $345,000 | Multiple | |
| Guarneri Gregory | $322,500 | -- | |
| Kimel Phyllis | $142,000 | -- |
Source: Public Records
Mortgage History
| Date | Status | Borrower | Loan Amount |
|---|---|---|---|
| Open | Brady Keith | $336,254 | |
| Previous Owner | Guarneri Gregory | $258,000 | |
| Previous Owner | Kimel Phyllis | $133,000 |
Source: Public Records
Tax History Compared to Growth
Tax History
| Year | Tax Paid | Tax Assessment Tax Assessment Total Assessment is a certain percentage of the fair market value that is determined by local assessors to be the total taxable value of land and additions on the property. | Land | Improvement |
|---|---|---|---|---|
| 2025 | $10,104 | $624,800 | $379,000 | $245,800 |
| 2024 | $9,539 | $568,300 | $327,000 | $241,300 |
| 2023 | $9,539 | $512,600 | $277,000 | $235,600 |
| 2022 | $8,185 | $386,300 | $162,000 | $224,300 |
| 2021 | $8,185 | $356,500 | $157,000 | $199,500 |
| 2020 | $7,976 | $343,500 | $146,200 | $197,300 |
| 2019 | $8,302 | $350,900 | $157,000 | $193,900 |
| 2018 | $7,664 | $321,900 | $137,000 | $184,900 |
| 2017 | $7,496 | $311,300 | $132,000 | $179,300 |
| 2016 | $7,094 | $291,700 | $117,000 | $174,700 |
| 2015 | $7,057 | $287,200 | $117,000 | $170,200 |
| 2014 | $6,416 | $242,300 | $107,000 | $135,300 |
Source: Public Records
Map
Nearby Homes
- 9 Cove Ct
- 10 Cove Ct
- 21 Bunker Hill Dr
- 91 Concord Cir
- 18 Plymouth Dr
- 12 Dantley Dr
- 14 Plymouth Dr
- 7 Nantucket Ct
- 9 Bell Ct
- 30 Heritage Dr
- 14 Cobblestone Ct
- 13 New Friendship Rd
- 99 Glen Arden Dr
- 10 Colonial Ct
- 12 Colonial Ct
- 25 Concord Cir
- 459 Shady Ln
- 3 Timberline Dr
- 231 Friendship Rd
- 12 Glen Arden Dr