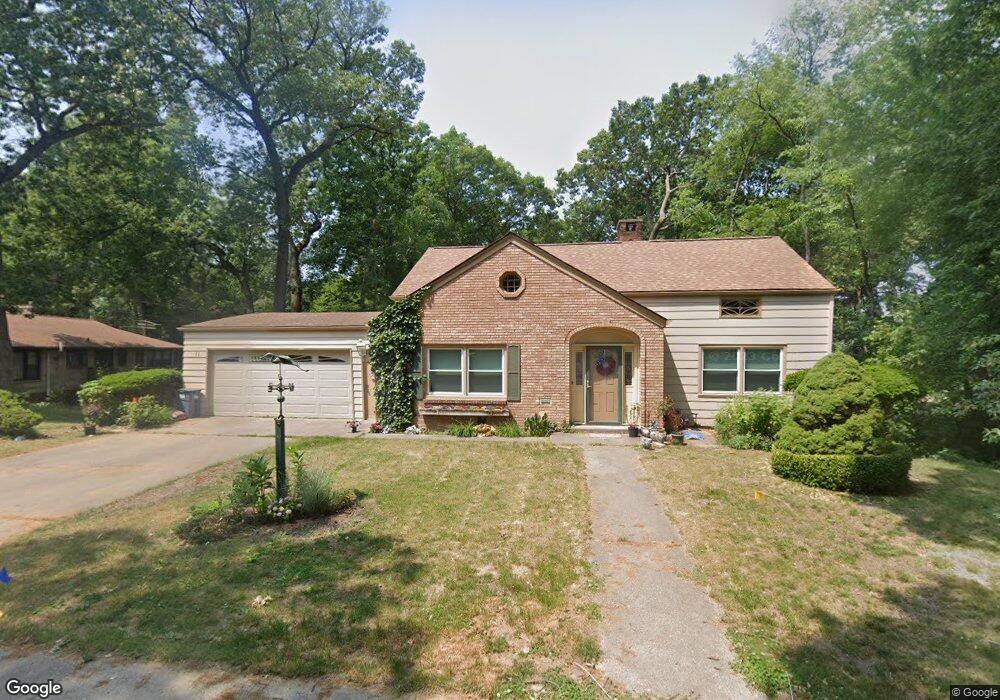
11 Crest Ln Battle Creek, MI 49017
Northeast Battle Creek NeighborhoodEstimated Value: $238,000 - $258,000
3
Beds
2
Baths
1,925
Sq Ft
$130/Sq Ft
Est. Value
About This Home
This home is located at 11 Crest Ln, Battle Creek, MI 49017 and is currently estimated at $250,210, approximately $129 per square foot. 11 Crest Ln is a home located in Calhoun County with nearby schools including Northwestern Middle School, Battle Creek Central High School, and St. Philip Catholic Central High School.
Ownership History
Date
Name
Owned For
Owner Type
Purchase Details
Closed on
Feb 15, 2008
Sold by
Rea Richard and Gordon Susan M
Bought by
Grimley Carole J
Current Estimated Value
Home Financials for this Owner
Home Financials are based on the most recent Mortgage that was taken out on this home.
Original Mortgage
$145,000
Outstanding Balance
$89,968
Interest Rate
5.75%
Mortgage Type
Purchase Money Mortgage
Estimated Equity
$160,242
Purchase Details
Closed on
Mar 1, 1999
Sold by
Allison Estate Irene S
Bought by
Rea and Gordon
Create a Home Valuation Report for This Property
The Home Valuation Report is an in-depth analysis detailing your home's value as well as a comparison with similar homes in the area
Home Values in the Area
Average Home Value in this Area
Purchase History
| Date | Buyer | Sale Price | Title Company |
|---|---|---|---|
| Grimley Carole J | $145,000 | Chicago Title Of Michigan | |
| Rea | $112,000 | -- |
Source: Public Records
Mortgage History
| Date | Status | Borrower | Loan Amount |
|---|---|---|---|
| Open | Grimley Carole J | $145,000 |
Source: Public Records
Tax History Compared to Growth
Tax History
| Year | Tax Paid | Tax Assessment Tax Assessment Total Assessment is a certain percentage of the fair market value that is determined by local assessors to be the total taxable value of land and additions on the property. | Land | Improvement |
|---|---|---|---|---|
| 2025 | -- | $108,500 | $0 | $0 |
| 2024 | $2,631 | $104,369 | $0 | $0 |
| 2023 | $3,007 | $87,898 | $0 | $0 |
| 2022 | $2,376 | $81,173 | $0 | $0 |
| 2021 | $2,837 | $78,819 | $0 | $0 |
| 2020 | $2,669 | $65,867 | $0 | $0 |
| 2019 | $2,658 | $67,050 | $0 | $0 |
| 2018 | $2,658 | $61,552 | $3,234 | $58,318 |
| 2017 | $2,576 | $59,914 | $0 | $0 |
| 2016 | $2,572 | $60,345 | $0 | $0 |
| 2015 | $3,458 | $55,546 | $7,369 | $48,177 |
| 2014 | $3,458 | $75,036 | $7,369 | $67,667 |
Source: Public Records
Map
Nearby Homes