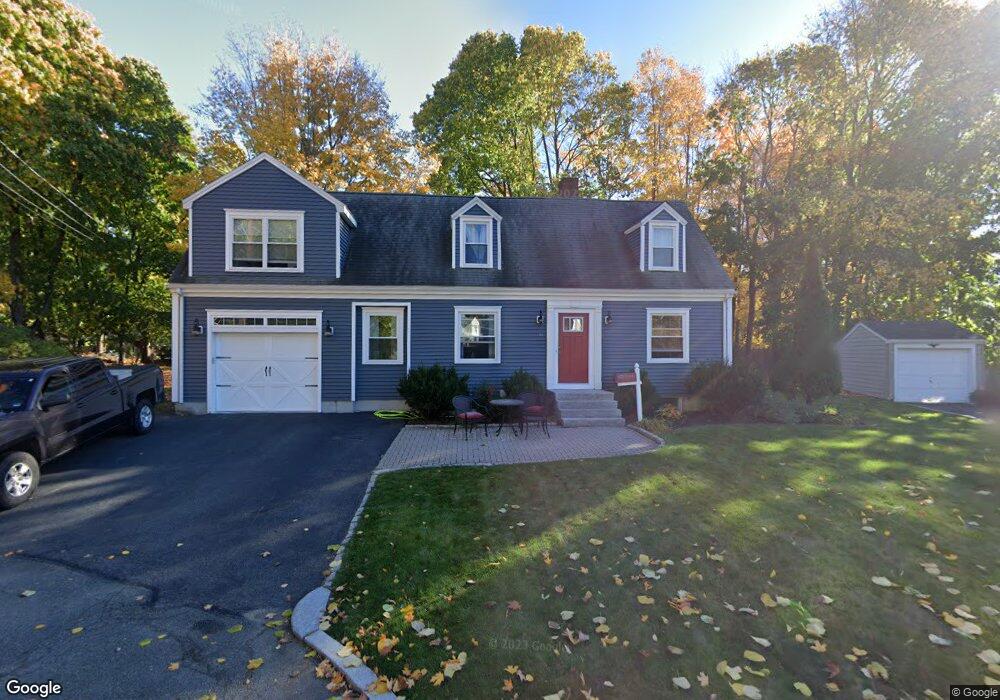
11 Cristofaro St Wakefield, MA 01880
Lakeside NeighborhoodEstimated Value: $751,053 - $797,000
3
Beds
2
Baths
1,450
Sq Ft
$536/Sq Ft
Est. Value
About This Home
This home is located at 11 Cristofaro St, Wakefield, MA 01880 and is currently estimated at $777,013, approximately $535 per square foot. 11 Cristofaro St is a home located in Middlesex County with nearby schools including Wakefield Memorial High School and St Joseph School.
Ownership History
Date
Name
Owned For
Owner Type
Purchase Details
Closed on
Jul 8, 2025
Sold by
Fitzpatrick Michele L and Fitzpatrick Sean M
Bought by
Fitzpatrick 2025 Rt and Fitzpatrick
Current Estimated Value
Purchase Details
Closed on
Nov 1, 2000
Sold by
Colleran William E and Colleran Mill R
Bought by
Duggan Dennis K and Duggan Patrice M
Purchase Details
Closed on
Aug 26, 1994
Sold by
Tierney John T and Tierney Mary V
Bought by
Colleran William E and Colleran Jill R
Create a Home Valuation Report for This Property
The Home Valuation Report is an in-depth analysis detailing your home's value as well as a comparison with similar homes in the area
Home Values in the Area
Average Home Value in this Area
Purchase History
| Date | Buyer | Sale Price | Title Company |
|---|---|---|---|
| Fitzpatrick 2025 Rt | -- | -- | |
| Fitzpatrick 2025 Rt | -- | -- | |
| Duggan Dennis K | $280,000 | -- | |
| Colleran William E | $171,000 | -- | |
| Colleran William E | $171,000 | -- |
Source: Public Records
Mortgage History
| Date | Status | Borrower | Loan Amount |
|---|---|---|---|
| Previous Owner | Colleran William E | $348,000 | |
| Previous Owner | Colleran William E | $35,000 |
Source: Public Records
Tax History Compared to Growth
Tax History
| Year | Tax Paid | Tax Assessment Tax Assessment Total Assessment is a certain percentage of the fair market value that is determined by local assessors to be the total taxable value of land and additions on the property. | Land | Improvement |
|---|---|---|---|---|
| 2025 | $7,422 | $653,900 | $340,300 | $313,600 |
| 2024 | $7,140 | $634,700 | $330,300 | $304,400 |
| 2023 | $6,894 | $587,700 | $305,800 | $281,900 |
| 2022 | $6,584 | $534,400 | $278,000 | $256,400 |
| 2021 | $6,206 | $487,500 | $258,300 | $229,200 |
| 2020 | $5,967 | $467,300 | $247,600 | $219,700 |
| 2019 | $5,789 | $451,200 | $239,100 | $212,100 |
| 2018 | $5,477 | $422,900 | $224,100 | $198,800 |
| 2017 | $5,250 | $402,900 | $213,500 | $189,400 |
| 2016 | $5,068 | $375,700 | $197,300 | $178,400 |
| 2015 | $4,734 | $351,200 | $184,400 | $166,800 |
| 2014 | $4,350 | $340,400 | $178,700 | $161,700 |
Source: Public Records
Map
Nearby Homes