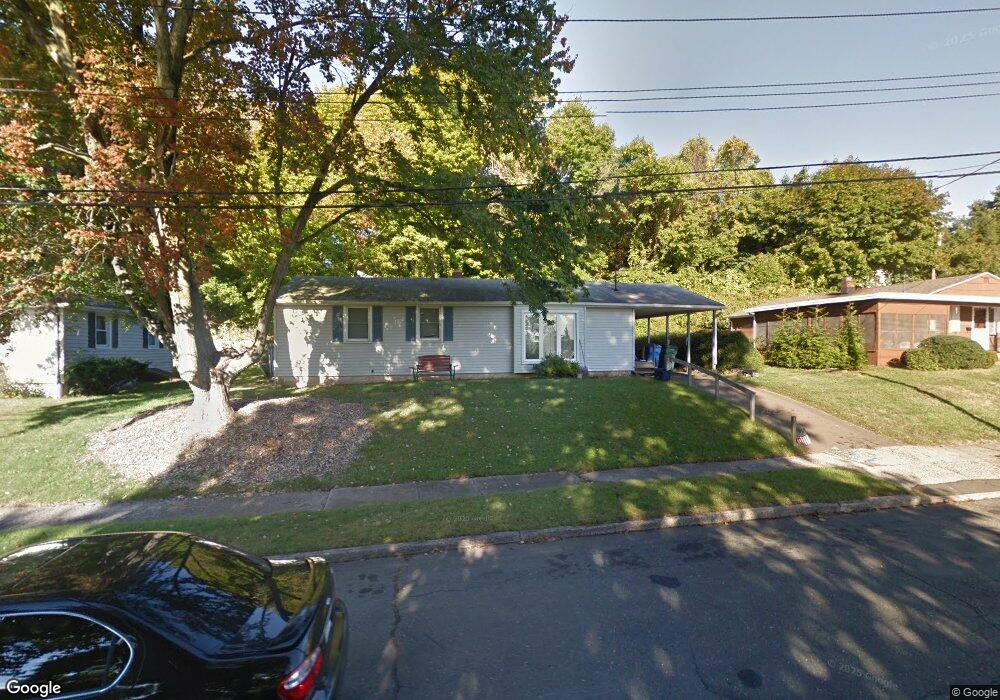
11 Curry Rd Hamden, CT 06517
Estimated Value: $319,028 - $362,000
3
Beds
1
Bath
1,141
Sq Ft
$301/Sq Ft
Est. Value
About This Home
This home is located at 11 Curry Rd, Hamden, CT 06517 and is currently estimated at $343,257, approximately $300 per square foot. 11 Curry Rd is a home located in New Haven County with nearby schools including Field Elementary School, Ridge Hill School, and Hamden Middle School.
Ownership History
Date
Name
Owned For
Owner Type
Purchase Details
Closed on
Jan 9, 2018
Sold by
Webb Jonathan R
Bought by
Us Bank Na
Current Estimated Value
Purchase Details
Closed on
May 11, 1992
Sold by
Ronne Robert L and Ronne Elizabeth
Bought by
Petroskey Rissa and Webb Jonathan R
Home Financials for this Owner
Home Financials are based on the most recent Mortgage that was taken out on this home.
Original Mortgage
$94,000
Interest Rate
5.88%
Mortgage Type
Purchase Money Mortgage
Create a Home Valuation Report for This Property
The Home Valuation Report is an in-depth analysis detailing your home's value as well as a comparison with similar homes in the area
Home Values in the Area
Average Home Value in this Area
Purchase History
| Date | Buyer | Sale Price | Title Company |
|---|---|---|---|
| Us Bank Na | -- | -- | |
| Us Bank Na | -- | -- | |
| Petroskey Rissa | $117,500 | -- |
Source: Public Records
Mortgage History
| Date | Status | Borrower | Loan Amount |
|---|---|---|---|
| Previous Owner | Petroskey Rissa | $160,000 | |
| Previous Owner | Petroskey Rissa | $94,000 |
Source: Public Records
Tax History Compared to Growth
Tax History
| Year | Tax Paid | Tax Assessment Tax Assessment Total Assessment is a certain percentage of the fair market value that is determined by local assessors to be the total taxable value of land and additions on the property. | Land | Improvement |
|---|---|---|---|---|
| 2025 | $10,357 | $199,640 | $60,760 | $138,880 |
| 2024 | $6,808 | $122,430 | $35,630 | $86,800 |
| 2023 | $6,903 | $122,430 | $35,630 | $86,800 |
| 2022 | $6,792 | $122,430 | $35,630 | $86,800 |
| 2021 | $6,420 | $122,430 | $35,630 | $86,800 |
| 2020 | $5,545 | $106,680 | $46,480 | $60,200 |
| 2019 | $5,212 | $106,680 | $46,480 | $60,200 |
| 2018 | $5,116 | $106,680 | $46,480 | $60,200 |
| 2017 | $4,828 | $106,680 | $46,480 | $60,200 |
| 2016 | $4,839 | $106,680 | $46,480 | $60,200 |
| 2015 | $4,904 | $119,980 | $48,720 | $71,260 |
| 2014 | $4,791 | $119,980 | $48,720 | $71,260 |
Source: Public Records
Map
Nearby Homes
- 2390 State St Unit 7D
- 317 Franklin Rd
- 60 Allene Dr
- 43 Mulberry Hill
- 207 Franklin Rd
- 37 Quaker Rd
- 43 Stevens St
- 15 Smith Dr
- 520 Hartford Turnpike
- 78 Edgecomb St
- 410 Waite St
- 47 Williamson Rd
- 780 Ridge Rd
- 33 Mather St
- 22 Webb St
- 19 Armory St
- 2022 Whitney Ave
- 55 Ranch Rd
- 1412 Whitney Ave Unit F3
- 1412 Whitney Ave Unit J1