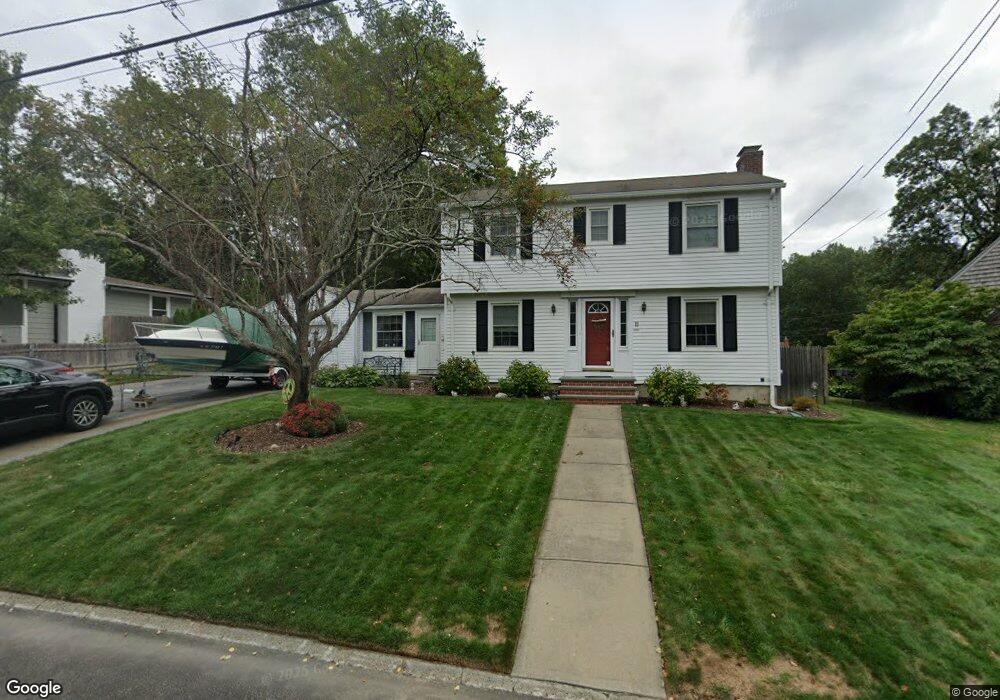
11 Cushing Rd Warwick, RI 02888
Spring Green NeighborhoodEstimated Value: $442,033 - $551,000
3
Beds
2
Baths
2,077
Sq Ft
$243/Sq Ft
Est. Value
About This Home
This home is located at 11 Cushing Rd, Warwick, RI 02888 and is currently estimated at $505,508, approximately $243 per square foot. 11 Cushing Rd is a home located in Kent County with nearby schools including St. Peter School and Saint Paul School.
Ownership History
Date
Name
Owned For
Owner Type
Purchase Details
Closed on
Nov 20, 2008
Sold by
Arenberg Josh L and Arenberg Deborah L
Bought by
Dentremont Paul E and Rossi-Detremont Keri L
Current Estimated Value
Home Financials for this Owner
Home Financials are based on the most recent Mortgage that was taken out on this home.
Original Mortgage
$137,000
Interest Rate
5.65%
Mortgage Type
Purchase Money Mortgage
Purchase Details
Closed on
Jul 25, 2001
Sold by
Bernal Phillip M and Bernal Rebecca A
Bought by
Arenberg Josh L and Arenberg Deborah L
Home Financials for this Owner
Home Financials are based on the most recent Mortgage that was taken out on this home.
Original Mortgage
$161,415
Interest Rate
7.18%
Mortgage Type
Purchase Money Mortgage
Purchase Details
Closed on
Sep 30, 1997
Sold by
Malloy Thomas F and Malloy Helen
Bought by
Bernal Phillip M and Bernal Rebecca
Create a Home Valuation Report for This Property
The Home Valuation Report is an in-depth analysis detailing your home's value as well as a comparison with similar homes in the area
Home Values in the Area
Average Home Value in this Area
Purchase History
| Date | Buyer | Sale Price | Title Company |
|---|---|---|---|
| Dentremont Paul E | $244,900 | -- | |
| Arenberg Josh L | $177,000 | -- | |
| Bernal Phillip M | $134,000 | -- |
Source: Public Records
Mortgage History
| Date | Status | Borrower | Loan Amount |
|---|---|---|---|
| Open | Bernal Phillip M | $117,150 | |
| Closed | Bernal Phillip M | $137,000 | |
| Previous Owner | Bernal Phillip M | $180,000 | |
| Previous Owner | Bernal Phillip M | $161,415 |
Source: Public Records
Tax History
| Year | Tax Paid | Tax Assessment Tax Assessment Total Assessment is a certain percentage of the fair market value that is determined by local assessors to be the total taxable value of land and additions on the property. | Land | Improvement |
|---|---|---|---|---|
| 2025 | $5,175 | $407,500 | $109,500 | $298,000 |
| 2024 | $4,839 | $334,400 | $95,200 | $239,200 |
| 2023 | $4,745 | $334,400 | $95,200 | $239,200 |
| 2022 | $4,624 | $246,900 | $58,700 | $188,200 |
| 2021 | $4,624 | $246,900 | $58,700 | $188,200 |
| 2020 | $4,624 | $246,900 | $58,700 | $188,200 |
| 2019 | $4,624 | $246,900 | $58,700 | $188,200 |
| 2018 | $4,143 | $199,200 | $52,200 | $147,000 |
| 2017 | $4,032 | $199,200 | $52,200 | $147,000 |
| 2016 | $4,032 | $199,200 | $52,200 | $147,000 |
| 2015 | $4,397 | $211,900 | $69,600 | $142,300 |
| 2014 | $4,251 | $211,900 | $69,600 | $142,300 |
| 2013 | $4,194 | $211,900 | $69,600 | $142,300 |
Source: Public Records
Map
Nearby Homes
- 821 Post Rd
- 63 Benbridge Ave
- 1020 Warwick Ave
- 25 Newfield Ave
- 80 George St
- 136 Sherwood Ave
- 120 Sherwood Ave
- 56 Errol St
- 127 Sherwood Ave
- 111 Sherwood Ave
- 171 Sherwood Ave
- 1052 Post Rd
- 15 Christopher Rhodes Way
- 6 Christopher Rhodes Way
- 210 Irving Rd
- 213 Easton Ave
- 20 Commodore Ave
- 115 Irving Rd
- 39 Holiday Ave
- 408 Fair St
- 3 Cushing Rd
- 12 Cushing Rd
- 155 Negansett Ave
- 20 Cushing Rd
- 179 Negansett Ave
- 29 Cushing Rd
- 28 Cushing Rd
- 147 Negansett Ave
- 168 Negansett Ave
- 225 Negansett Ave
- 219 Negansett Ave
- 5 Bagley Rd
- 151 Posnegansett Ave
- 37 Cushing Rd
- 38 Cushing Rd
- 231 Negansett Ave
- 137 Negansett Ave
- 12 Bagley Rd
- 161 Posneganset
- 161 Posnegansett Ave
Your Personal Tour Guide
Ask me questions while you tour the home.