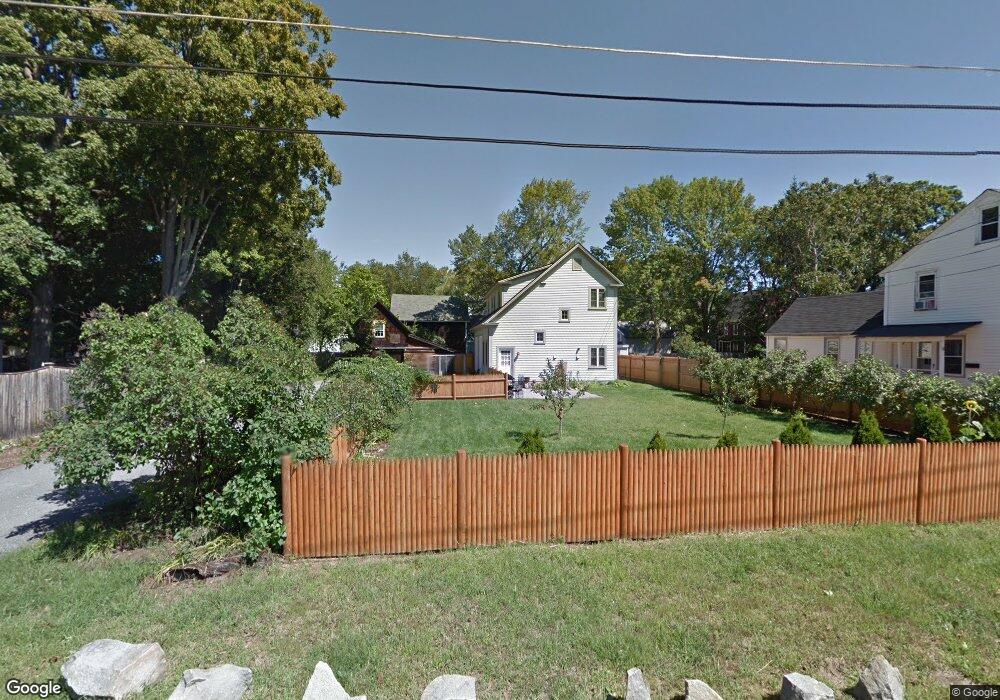
11 Dakin St Concord, NH 03301
South End NeighborhoodEstimated Value: $395,000 - $447,000
1
Bed
1
Bath
832
Sq Ft
$500/Sq Ft
Est. Value
About This Home
This home is located at 11 Dakin St, Concord, NH 03301 and is currently estimated at $415,721, approximately $499 per square foot. 11 Dakin St is a home located in Merrimack County with nearby schools including Abbot-Downing School, Rundlett Middle School, and Concord High School.
Ownership History
Date
Name
Owned For
Owner Type
Purchase Details
Closed on
Nov 13, 2007
Sold by
Logan Hedley D and Logan Annie Dee
Bought by
Conaway Sean M and Conaway Korene P
Current Estimated Value
Home Financials for this Owner
Home Financials are based on the most recent Mortgage that was taken out on this home.
Original Mortgage
$145,000
Interest Rate
6.47%
Mortgage Type
Purchase Money Mortgage
Create a Home Valuation Report for This Property
The Home Valuation Report is an in-depth analysis detailing your home's value as well as a comparison with similar homes in the area
Home Values in the Area
Average Home Value in this Area
Purchase History
| Date | Buyer | Sale Price | Title Company |
|---|---|---|---|
| Conaway Sean M | $220,000 | -- |
Source: Public Records
Mortgage History
| Date | Status | Borrower | Loan Amount |
|---|---|---|---|
| Open | Conaway Sean M | $176,000 | |
| Closed | Conaway Sean M | $145,000 |
Source: Public Records
Tax History
| Year | Tax Paid | Tax Assessment Tax Assessment Total Assessment is a certain percentage of the fair market value that is determined by local assessors to be the total taxable value of land and additions on the property. | Land | Improvement |
|---|---|---|---|---|
| 2025 | $7,595 | $260,900 | $104,700 | $156,200 |
| 2024 | $7,224 | $260,900 | $104,700 | $156,200 |
| 2023 | $7,008 | $260,900 | $104,700 | $156,200 |
| 2022 | $6,755 | $260,900 | $104,700 | $156,200 |
| 2021 | $6,554 | $260,900 | $104,700 | $156,200 |
| 2020 | $6,369 | $238,000 | $87,500 | $150,500 |
| 2019 | $6,039 | $217,400 | $86,100 | $131,300 |
| 2018 | $5,521 | $199,100 | $82,700 | $116,400 |
| 2017 | $5,433 | $192,400 | $81,200 | $111,200 |
| 2016 | $5,083 | $183,700 | $81,200 | $102,500 |
| 2015 | $4,853 | $177,500 | $73,800 | $103,700 |
| 2014 | $4,759 | $177,500 | $73,800 | $103,700 |
| 2013 | $4,464 | $174,500 | $73,800 | $100,700 |
| 2012 | $4,253 | $174,500 | $73,800 | $100,700 |
Source: Public Records
Map
Nearby Homes
Your Personal Tour Guide
Ask me questions while you tour the home.