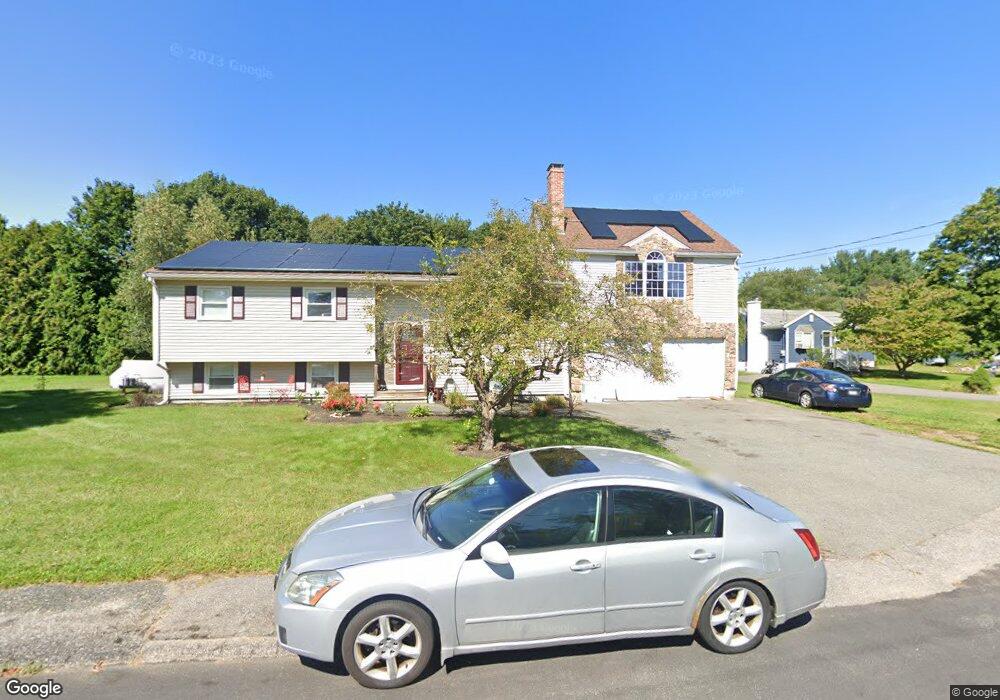
11 Dalmor Rd Bellingham, MA 02019
Estimated Value: $552,051 - $634,000
4
Beds
2
Baths
2,622
Sq Ft
$227/Sq Ft
Est. Value
About This Home
This home is located at 11 Dalmor Rd, Bellingham, MA 02019 and is currently estimated at $594,513, approximately $226 per square foot. 11 Dalmor Rd is a home located in Norfolk County with nearby schools including Joseph F. DiPietro Elementary, Bellingham High School, and Rise Prep Mayoral Academy Middle School.
Ownership History
Date
Name
Owned For
Owner Type
Purchase Details
Closed on
Jan 31, 2000
Sold by
Sepulveda Luis M
Bought by
Mcquillan Rene A and Mcquillan Angela M
Current Estimated Value
Home Financials for this Owner
Home Financials are based on the most recent Mortgage that was taken out on this home.
Original Mortgage
$169,913
Interest Rate
7.83%
Mortgage Type
Purchase Money Mortgage
Purchase Details
Closed on
Oct 24, 1995
Sold by
Mahoney Paul M and Mahoney Kristine L
Bought by
Sepulveda Luis M and Sepulveda Dawn M
Purchase Details
Closed on
Aug 30, 1989
Sold by
Nolan Daniel J
Bought by
Mahoney Paul M
Create a Home Valuation Report for This Property
The Home Valuation Report is an in-depth analysis detailing your home's value as well as a comparison with similar homes in the area
Home Values in the Area
Average Home Value in this Area
Purchase History
| Date | Buyer | Sale Price | Title Company |
|---|---|---|---|
| Mcquillan Rene A | $170,000 | -- | |
| Sepulveda Luis M | $139,000 | -- | |
| Mahoney Paul M | $139,000 | -- |
Source: Public Records
Mortgage History
| Date | Status | Borrower | Loan Amount |
|---|---|---|---|
| Open | Mahoney Paul M | $212,000 | |
| Closed | Mahoney Paul M | $168,037 | |
| Closed | Mahoney Paul M | $169,913 |
Source: Public Records
Tax History
| Year | Tax Paid | Tax Assessment Tax Assessment Total Assessment is a certain percentage of the fair market value that is determined by local assessors to be the total taxable value of land and additions on the property. | Land | Improvement |
|---|---|---|---|---|
| 2025 | $5,608 | $446,500 | $167,200 | $279,300 |
| 2024 | $5,368 | $417,400 | $152,600 | $264,800 |
| 2023 | $5,174 | $396,500 | $145,400 | $251,100 |
| 2022 | $5,067 | $359,900 | $121,200 | $238,700 |
| 2021 | $4,922 | $341,600 | $121,200 | $220,400 |
| 2020 | $4,833 | $339,900 | $121,200 | $218,700 |
| 2019 | $4,735 | $333,200 | $121,200 | $212,000 |
| 2018 | $4,479 | $310,800 | $116,600 | $194,200 |
| 2017 | $4,352 | $303,500 | $116,600 | $186,900 |
| 2016 | $4,150 | $290,400 | $114,600 | $175,800 |
| 2015 | $3,980 | $279,300 | $110,200 | $169,100 |
| 2014 | $3,990 | $272,200 | $107,700 | $164,500 |
Source: Public Records
Map
Nearby Homes
- 101 Pine Grove Ave
- 11 Quail Run Rd
- 70 Oswego St
- 36 Indian Run Rd
- 21 Irving St
- 352 Lake St
- 5 Bernier Ln
- 9 Brookfield Ln
- 90 Pleasant St
- 65 Palmetto Dr Unit 65
- 21 Palmetto Dr Unit 21
- 82 Paine St
- 24 Palmetto Dr Unit 24
- 60 Freeman St
- 9 Pebble Cir Unit 9
- 0 North St Unit 73440626
- 194 Paine St
- 925 Washington St
- 202 Paine St
- 11 Bellingham Rd
Your Personal Tour Guide
Ask me questions while you tour the home.