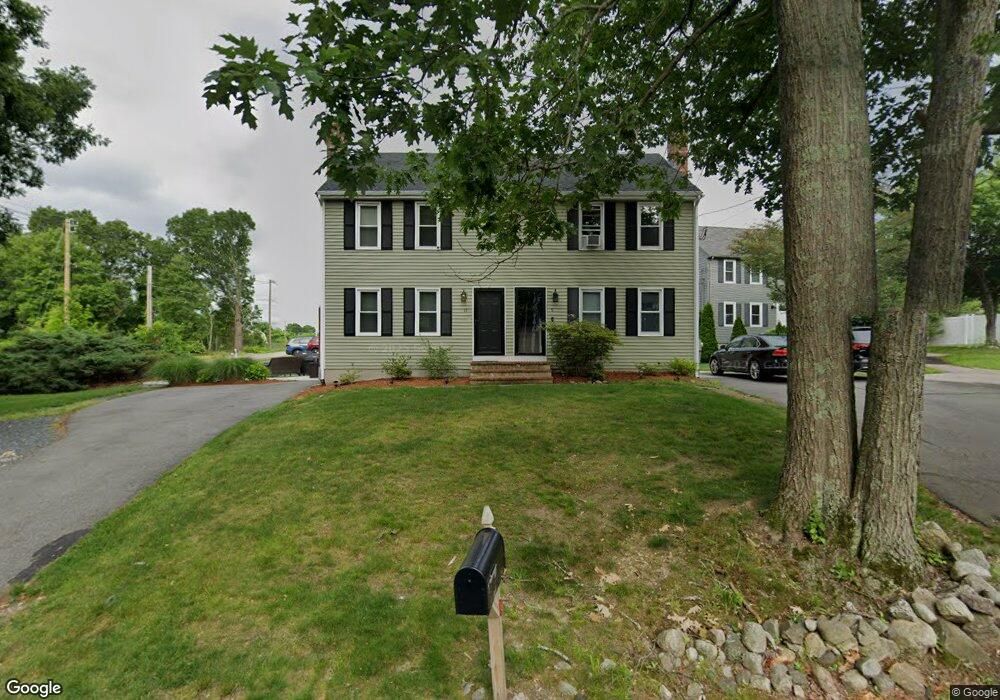
11 Dane St Unit 11,1 Mansfield, MA 02048
Estimated Value: $373,000 - $392,258
2
Beds
2
Baths
1,300
Sq Ft
$293/Sq Ft
Est. Value
About This Home
This home is located at 11 Dane St Unit 11,1, Mansfield, MA 02048 and is currently estimated at $380,815, approximately $292 per square foot. 11 Dane St Unit 11,1 is a home located in Bristol County with nearby schools including Everett W. Robinson Elementary School, Jordan/Jackson Elementary School, and Harold L. Qualters Middle School.
Ownership History
Date
Name
Owned For
Owner Type
Purchase Details
Closed on
Mar 5, 2019
Sold by
Brown Eric E
Bought by
Holske Tyler
Current Estimated Value
Home Financials for this Owner
Home Financials are based on the most recent Mortgage that was taken out on this home.
Original Mortgage
$218,500
Outstanding Balance
$192,099
Interest Rate
4.4%
Mortgage Type
New Conventional
Estimated Equity
$188,716
Purchase Details
Closed on
Apr 6, 2018
Sold by
Wronski Stanley J
Bought by
Brown Eric E
Home Financials for this Owner
Home Financials are based on the most recent Mortgage that was taken out on this home.
Original Mortgage
$123,000
Interest Rate
4.63%
Mortgage Type
New Conventional
Purchase Details
Closed on
Dec 3, 1997
Sold by
Capone Daniel J
Bought by
Wronski Stanley J
Create a Home Valuation Report for This Property
The Home Valuation Report is an in-depth analysis detailing your home's value as well as a comparison with similar homes in the area
Home Values in the Area
Average Home Value in this Area
Purchase History
| Date | Buyer | Sale Price | Title Company |
|---|---|---|---|
| Holske Tyler | $230,000 | -- | |
| Brown Eric E | $168,000 | -- | |
| Wronski Stanley J | $84,000 | -- |
Source: Public Records
Mortgage History
| Date | Status | Borrower | Loan Amount |
|---|---|---|---|
| Open | Holske Tyler | $218,500 | |
| Previous Owner | Brown Eric E | $123,000 |
Source: Public Records
Tax History Compared to Growth
Tax History
| Year | Tax Paid | Tax Assessment Tax Assessment Total Assessment is a certain percentage of the fair market value that is determined by local assessors to be the total taxable value of land and additions on the property. | Land | Improvement |
|---|---|---|---|---|
| 2025 | $3,805 | $288,900 | $0 | $288,900 |
| 2024 | $3,467 | $256,800 | $0 | $256,800 |
| 2023 | $3,301 | $234,300 | $0 | $234,300 |
| 2022 | $3,278 | $216,100 | $0 | $216,100 |
| 2021 | $3,329 | $216,700 | $0 | $216,700 |
| 2020 | $2,458 | $160,000 | $0 | $160,000 |
| 2019 | $3,318 | $218,000 | $0 | $218,000 |
| 2018 | $1,774 | $210,600 | $0 | $210,600 |
| 2017 | $3,163 | $210,600 | $0 | $210,600 |
| 2016 | $2,891 | $187,600 | $0 | $187,600 |
| 2015 | $2,695 | $173,900 | $0 | $173,900 |
Source: Public Records
Map
Nearby Homes
- 619 N Main St
- 44 Angell St Unit 44
- 28 Angell St
- 82 Brook St
- 22 Pleasant St Unit C
- 12 Spring St
- 150 Rumford Ave Unit 110
- 356 Central St
- 277 Central St
- 166 Chauncy St
- 28 Court St
- 261 East St
- 1 Revere Dr
- 631 East St Unit E203
- 11 W Belcher Rd Unit 2
- 18 Winter St Unit E
- 14 Winter St Unit B
- 35 Independence Dr Unit 35
- 414 Branch St
- 84 Cocasset St Unit A6