11 Del Rey Cir Unit 2 Salinas, CA 93901
South Salinas NeighborhoodEstimated Value: $758,000 - $810,000
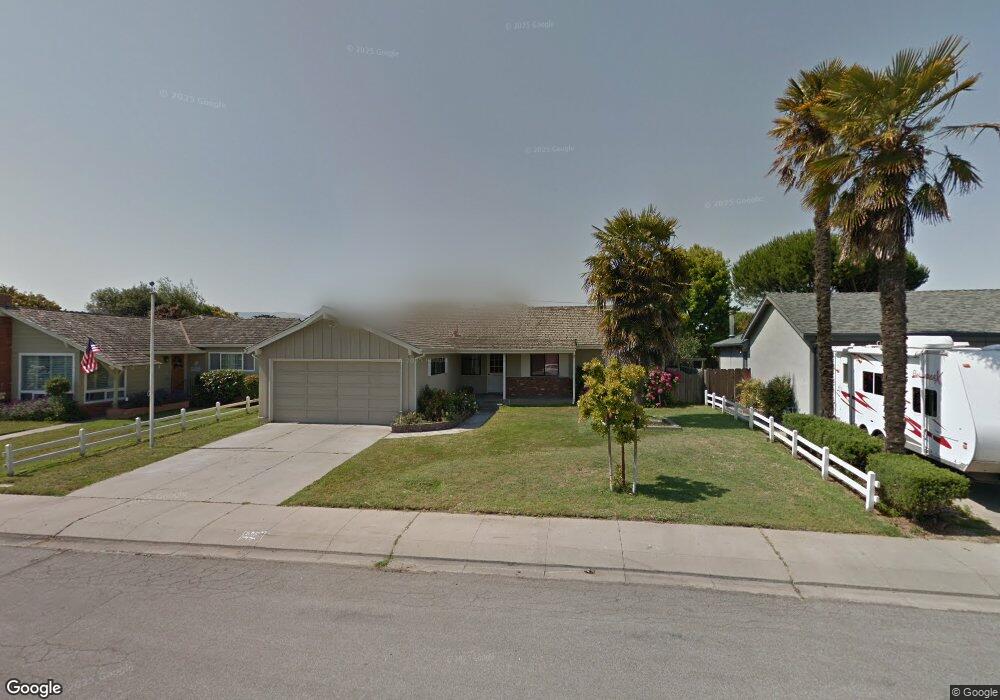
About This Home
This home is located at 11 Del Rey Cir Unit 2, Salinas, CA 93901 and is currently estimated at $781,586, approximately $573 per square foot. 11 Del Rey Cir Unit 2 is a home located in Monterey County with nearby schools including Monterey Park Elementary School, Lincoln Elementary School, and Mission Park Elementary School.
Ownership History
We collect this data history from publicly available records. To have your information removed, we recommend requesting removal directly through your county’s website.
Purchase Details
Home Financials for this Owner
Home Financials are based on the most recent Mortgage that was taken out on this home.Purchase Details
Home Financials for this Owner
Home Financials are based on the most recent Mortgage that was taken out on this home.Purchase Details
Home Financials for this Owner
Home Financials are based on the most recent Mortgage that was taken out on this home.Purchase Details
Home Financials for this Owner
Home Financials are based on the most recent Mortgage that was taken out on this home.Purchase Details
Purchase Details
Home Financials for this Owner
Home Financials are based on the most recent Mortgage that was taken out on this home.Purchase Details
Home Values in the Area
Average Home Value in this Area
Purchase History
We collect this data history from publicly available records. To have your information removed, we recommend requesting removal directly through your county’s website.
| Date | Buyer | Sale Price | Title Company |
|---|---|---|---|
| -- | Accommodation | ||
| -- | Bnt Title Company Of Ca | ||
| -- | Amrock Llc | ||
| -- | Amrock Llc | ||
| -- | Fidelity National Title Co | ||
| -- | Fidelity National Title Co | ||
| -- | None Available | ||
| $226,000 | Old Republic Title Company | ||
| -- | -- |
Mortgage History
We collect this data history from publicly available records. To have your information removed, we recommend requesting removal directly through your county’s website.
| Date | Status | Borrower | Loan Amount |
|---|---|---|---|
| Open | $397,000 | ||
| Closed | $373,745 | ||
| Closed | $338,000 | ||
| Previous Owner | $180,800 |
Tax History
We collect this data history from publicly available records. To have your information removed, we recommend requesting removal directly through your county’s website.
| Year | Tax Paid | Tax Assessment Tax Assessment Total Assessment is a certain percentage of the fair market value that is determined by local assessors to be the total taxable value of land and additions on the property. | Land | Improvement |
|---|---|---|---|---|
| 2025 | $3,913 | $347,335 | $138,314 | $209,021 |
| 2024 | $3,913 | $340,525 | $135,602 | $204,923 |
| 2023 | $3,780 | $333,849 | $132,944 | $200,905 |
| 2022 | $3,637 | $327,304 | $130,338 | $196,966 |
| 2021 | $3,492 | $320,887 | $127,783 | $193,104 |
| 2020 | $3,395 | $317,597 | $126,473 | $191,124 |
| 2019 | $3,369 | $311,371 | $123,994 | $187,377 |
| 2018 | $3,325 | $305,266 | $121,563 | $183,703 |
| 2017 | $3,326 | $299,281 | $119,180 | $180,101 |
| 2016 | $3,327 | $293,414 | $116,844 | $176,570 |
| 2015 | $3,355 | $289,007 | $115,089 | $173,918 |
| 2014 | $3,129 | $283,347 | $112,835 | $170,512 |
Map
- 1067 Padre Dr Unit 1
- 1067 Padre Dr Unit 2
- 1056 Padre Dr Unit 4
- 138 Nissen Rd Unit 1
- 1052 Padre Dr Unit 3
- 1051 Padre Dr Unit 7
- 1051 Riker St Unit 7
- 906 Bautista Dr
- 50 Katherine Ave
- 1310 Primavera St Unit 109
- 54 Katherine Ave
- 22 San Juan Dr
- 222 Encinada Dr
- 1253 Los Olivos Dr Unit 5
- 251 La Mesa Dr
- 69 Geil St
- 40 Oak St
- 202 Pine St
- 239 Oak St
- 219 Pine St
- 7 Del Rey Cir
- 1234 Padre Dr
- 114 Del Mar Dr
- 19 Del Rey Cir
- 120 Del Mar Dr
- 1218 Padre Dr
- 12 Del Rey Cir
- 1240 Padre Dr
- 126 Del Mar Dr
- 16 Del Rey Cir
- 27 Del Rey Cir
- 1214 Padre Dr
- 1227 Padre Dr
- 132 Del Mar Dr
- 24 Del Rey Cir
- 1235 Padre Dr Unit 1
- 33 Del Rey Cir
- 1219 Padre Dr Unit 2
- 115 Nissen Rd
- 136 Del Mar Dr
Ask me questions while you tour the home.