11 Deschenes Rd Rindge, NH 03461
Estimated Value: $139,000 - $264,000
2
Beds
1
Bath
890
Sq Ft
$245/Sq Ft
Est. Value
About This Home
This home is located at 11 Deschenes Rd, Rindge, NH 03461 and is currently estimated at $218,024, approximately $244 per square foot. 11 Deschenes Rd is a home located in Cheshire County with nearby schools including Rindge Memorial School, Conant Middle High School, and Conant High School.
Ownership History
Date
Name
Owned For
Owner Type
Purchase Details
Closed on
Jun 7, 2017
Sold by
Bartlett Phillip F
Bought by
Bartlett Christopher A
Current Estimated Value
Home Financials for this Owner
Home Financials are based on the most recent Mortgage that was taken out on this home.
Original Mortgage
$97,000
Outstanding Balance
$80,706
Interest Rate
4.03%
Mortgage Type
Purchase Money Mortgage
Estimated Equity
$137,318
Purchase Details
Closed on
Jun 15, 2015
Sold by
Letourneau Luke P
Bought by
Bartlett Phillip F
Home Financials for this Owner
Home Financials are based on the most recent Mortgage that was taken out on this home.
Original Mortgage
$87,000
Interest Rate
3.65%
Mortgage Type
New Conventional
Create a Home Valuation Report for This Property
The Home Valuation Report is an in-depth analysis detailing your home's value as well as a comparison with similar homes in the area
Home Values in the Area
Average Home Value in this Area
Purchase History
| Date | Buyer | Sale Price | Title Company |
|---|---|---|---|
| Bartlett Christopher A | $100,000 | -- | |
| Bartlett Phillip F | $90,000 | -- |
Source: Public Records
Mortgage History
| Date | Status | Borrower | Loan Amount |
|---|---|---|---|
| Open | Bartlett Christopher A | $97,000 | |
| Previous Owner | Bartlett Phillip F | $87,000 |
Source: Public Records
Tax History Compared to Growth
Tax History
| Year | Tax Paid | Tax Assessment Tax Assessment Total Assessment is a certain percentage of the fair market value that is determined by local assessors to be the total taxable value of land and additions on the property. | Land | Improvement |
|---|---|---|---|---|
| 2024 | $2,736 | $108,100 | $56,400 | $51,700 |
| 2023 | $2,707 | $108,100 | $56,400 | $51,700 |
| 2022 | $2,411 | $104,700 | $56,400 | $48,300 |
| 2021 | $2,371 | $104,700 | $56,400 | $48,300 |
| 2020 | $2,351 | $104,700 | $56,400 | $48,300 |
| 2019 | $2,312 | $83,300 | $46,500 | $36,800 |
| 2018 | $2,291 | $83,300 | $46,500 | $36,800 |
| 2017 | $2,265 | $83,300 | $46,500 | $36,800 |
| 2016 | $2,325 | $83,300 | $46,500 | $36,800 |
| 2015 | $2,323 | $83,300 | $46,500 | $36,800 |
| 2014 | $2,345 | $90,100 | $52,000 | $38,100 |
| 2013 | $2,294 | $90,100 | $52,000 | $38,100 |
Source: Public Records
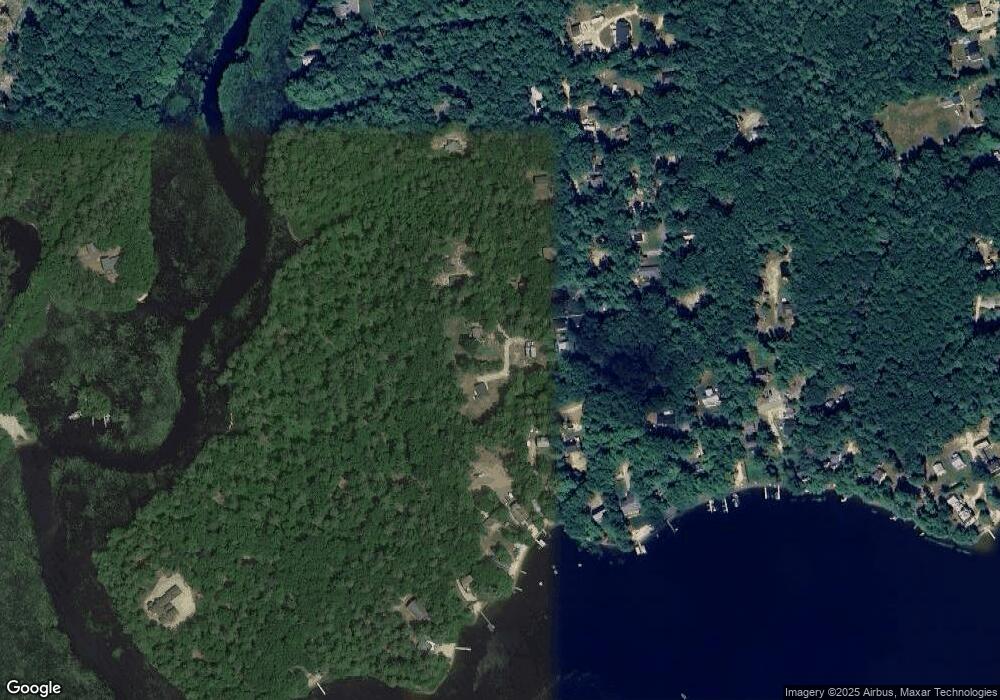
Map
Nearby Homes