Estimated Value: $1,510,000 - $1,837,000
4
Beds
3
Baths
1,943
Sq Ft
$872/Sq Ft
Est. Value
About This Home
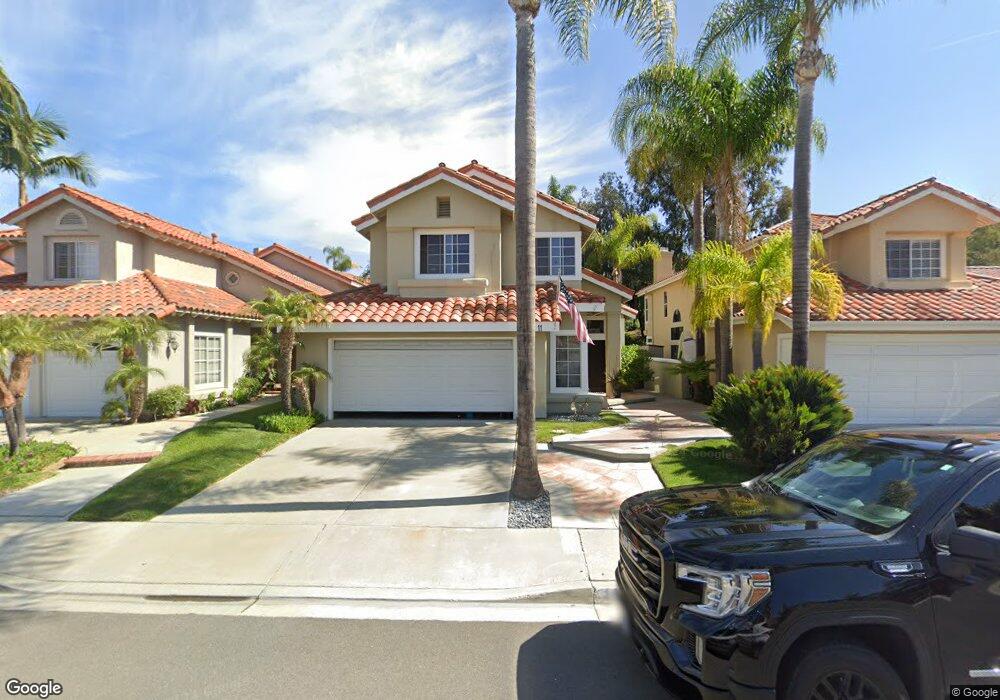
This home is located at 11 Dion, Laguna Niguel, CA 92677 and is currently estimated at $1,694,628, approximately $872 per square foot. 11 Dion is a home located in Orange County with nearby schools including George White Elementary, Niguel Hills Middle School, and Dana Hills High School.
Ownership History
Date
Name
Owned For
Owner Type
Purchase Details
Closed on
Dec 28, 2021
Sold by
Dennis Campbell Clayton and Dennis Elene N
Bought by
Callas-Campbell Family Trust
Current Estimated Value
Purchase Details
Closed on
Feb 12, 2001
Sold by
Sisoyev George and Sisoyev Laurie K
Bought by
Campbell Clayton Dennis and Callas Campbell Elene N
Home Financials for this Owner
Home Financials are based on the most recent Mortgage that was taken out on this home.
Original Mortgage
$346,400
Interest Rate
7.06%
Create a Home Valuation Report for This Property
The Home Valuation Report is an in-depth analysis detailing your home's value as well as a comparison with similar homes in the area
Home Values in the Area
Average Home Value in this Area
Purchase History
| Date | Buyer | Sale Price | Title Company |
|---|---|---|---|
| Callas-Campbell Family Trust | -- | None Listed On Document | |
| Campbell Clayton Dennis | $433,000 | Fidelity National Title Ins |
Source: Public Records
Mortgage History
| Date | Status | Borrower | Loan Amount |
|---|---|---|---|
| Previous Owner | Campbell Clayton Dennis | $346,400 |
Source: Public Records
Tax History Compared to Growth
Tax History
| Year | Tax Paid | Tax Assessment Tax Assessment Total Assessment is a certain percentage of the fair market value that is determined by local assessors to be the total taxable value of land and additions on the property. | Land | Improvement |
|---|---|---|---|---|
| 2025 | $6,420 | $652,455 | $377,660 | $274,795 |
| 2024 | $6,420 | $639,662 | $370,255 | $269,407 |
| 2023 | $6,283 | $627,120 | $362,995 | $264,125 |
| 2022 | $6,162 | $614,824 | $355,877 | $258,947 |
| 2021 | $6,042 | $602,769 | $348,899 | $253,870 |
| 2020 | $5,981 | $596,589 | $345,322 | $251,267 |
| 2019 | $5,862 | $584,892 | $338,551 | $246,341 |
| 2018 | $5,748 | $573,424 | $331,913 | $241,511 |
| 2017 | $5,634 | $562,181 | $325,405 | $236,776 |
| 2016 | $5,525 | $551,158 | $319,024 | $232,134 |
| 2015 | $5,441 | $542,880 | $314,232 | $228,648 |
| 2014 | $5,335 | $532,246 | $308,076 | $224,170 |
Source: Public Records
Map
Nearby Homes