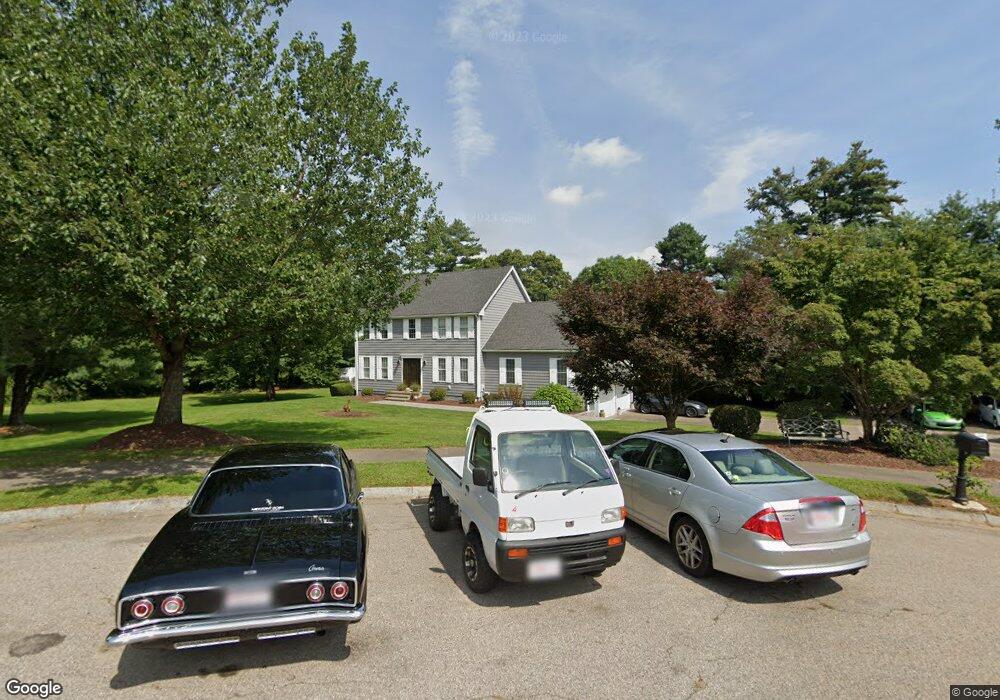
11 Dom Lea Cir Franklin, MA 02038
Wadsworth NeighborhoodEstimated Value: $945,000 - $1,034,000
4
Beds
4
Baths
2,658
Sq Ft
$376/Sq Ft
Est. Value
About This Home
This home is located at 11 Dom Lea Cir, Franklin, MA 02038 and is currently estimated at $999,412, approximately $376 per square foot. 11 Dom Lea Cir is a home located in Norfolk County with nearby schools including Jefferson Elementary School, Remington Middle School, and Franklin High School.
Ownership History
Date
Name
Owned For
Owner Type
Purchase Details
Closed on
Mar 27, 1998
Sold by
Cobblestone Bldrs Inc
Bought by
Wolowacki William R and Wolowacki Lisa D
Current Estimated Value
Home Financials for this Owner
Home Financials are based on the most recent Mortgage that was taken out on this home.
Original Mortgage
$214,600
Outstanding Balance
$40,239
Interest Rate
6.96%
Mortgage Type
Purchase Money Mortgage
Estimated Equity
$959,173
Create a Home Valuation Report for This Property
The Home Valuation Report is an in-depth analysis detailing your home's value as well as a comparison with similar homes in the area
Home Values in the Area
Average Home Value in this Area
Purchase History
| Date | Buyer | Sale Price | Title Company |
|---|---|---|---|
| Wolowacki William R | $229,900 | -- |
Source: Public Records
Mortgage History
| Date | Status | Borrower | Loan Amount |
|---|---|---|---|
| Open | Wolowacki William R | $214,600 |
Source: Public Records
Tax History Compared to Growth
Tax History
| Year | Tax Paid | Tax Assessment Tax Assessment Total Assessment is a certain percentage of the fair market value that is determined by local assessors to be the total taxable value of land and additions on the property. | Land | Improvement |
|---|---|---|---|---|
| 2025 | $10,759 | $925,900 | $394,800 | $531,100 |
| 2024 | $11,013 | $934,100 | $394,800 | $539,300 |
| 2023 | $10,499 | $834,600 | $377,300 | $457,300 |
| 2022 | $9,895 | $704,300 | $292,500 | $411,800 |
| 2021 | $9,890 | $675,100 | $281,000 | $394,100 |
| 2020 | $9,610 | $662,300 | $283,800 | $378,500 |
| 2019 | $9,372 | $639,300 | $261,100 | $378,200 |
| 2018 | $9,099 | $621,100 | $275,300 | $345,800 |
| 2017 | $9,180 | $629,600 | $283,800 | $345,800 |
| 2016 | $8,797 | $606,700 | $262,200 | $344,500 |
| 2015 | $8,631 | $581,600 | $237,100 | $344,500 |
| 2014 | $7,472 | $517,100 | $228,000 | $289,100 |
Source: Public Records
Map
Nearby Homes
- 4 Tobacco Rd
- 14 Stanford Rd
- 9 Jefferson Rd
- 241 Prospect St
- 5 Wadsworth Farm Rd
- 71 Oxford Dr
- 19 Peters Ln
- 16 Peters Ln
- 20 Bertine St
- 352 Lake St
- 2 Rhodes Way
- 2 Michael Rd
- 55 Blackberry Hill Rd
- 295 Lake St
- 246 Washington St
- 7 Chris Dr
- 106 Maple Brook Rd Unit 106
- 19 Geordan Ave
- 2095 West St
- 120 Stone Ridge Rd Unit 120